


The Dollar index is in a bullish short-term channel breaking above the 4-hour cloud resistance. Price is approaching the 61.8% Fibonacci retracement of the recent decline. A rejection around this area will be a bearish sign and what I expect. The upward bounce is considered corrective.
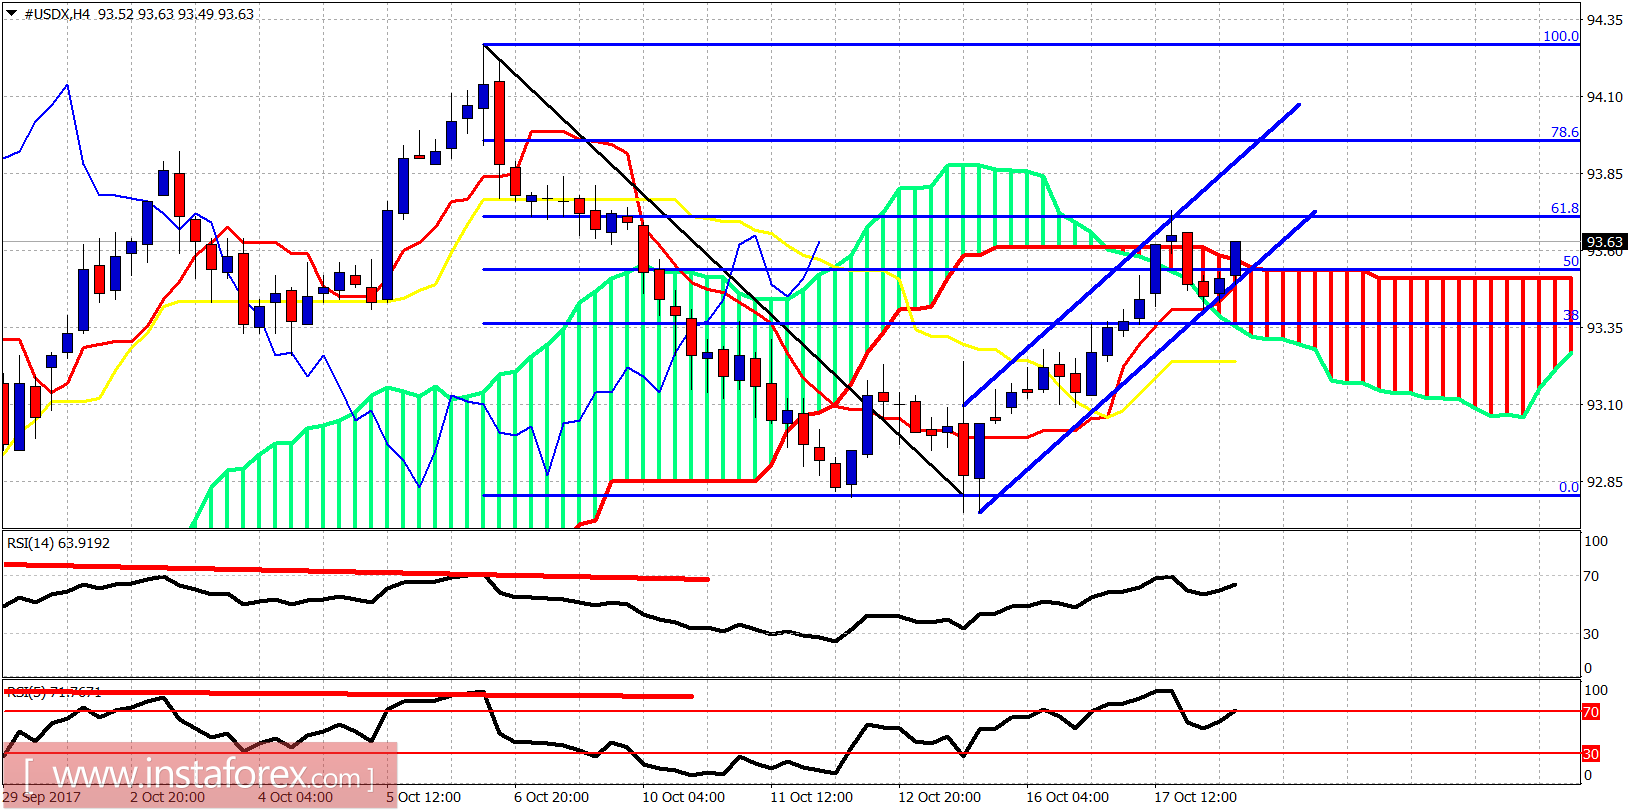
Blue lines - bullish channel
The Dollar index is breaking above the 4-hour cloud. Price is inside the short-term bullish channel but there are a lot of chances even if price makes a new higher high above 93.73. In this case, it would produce a bearish divergence in the RSI and would complete the final correction before down trend resumes.
Blue lines - bullish channel
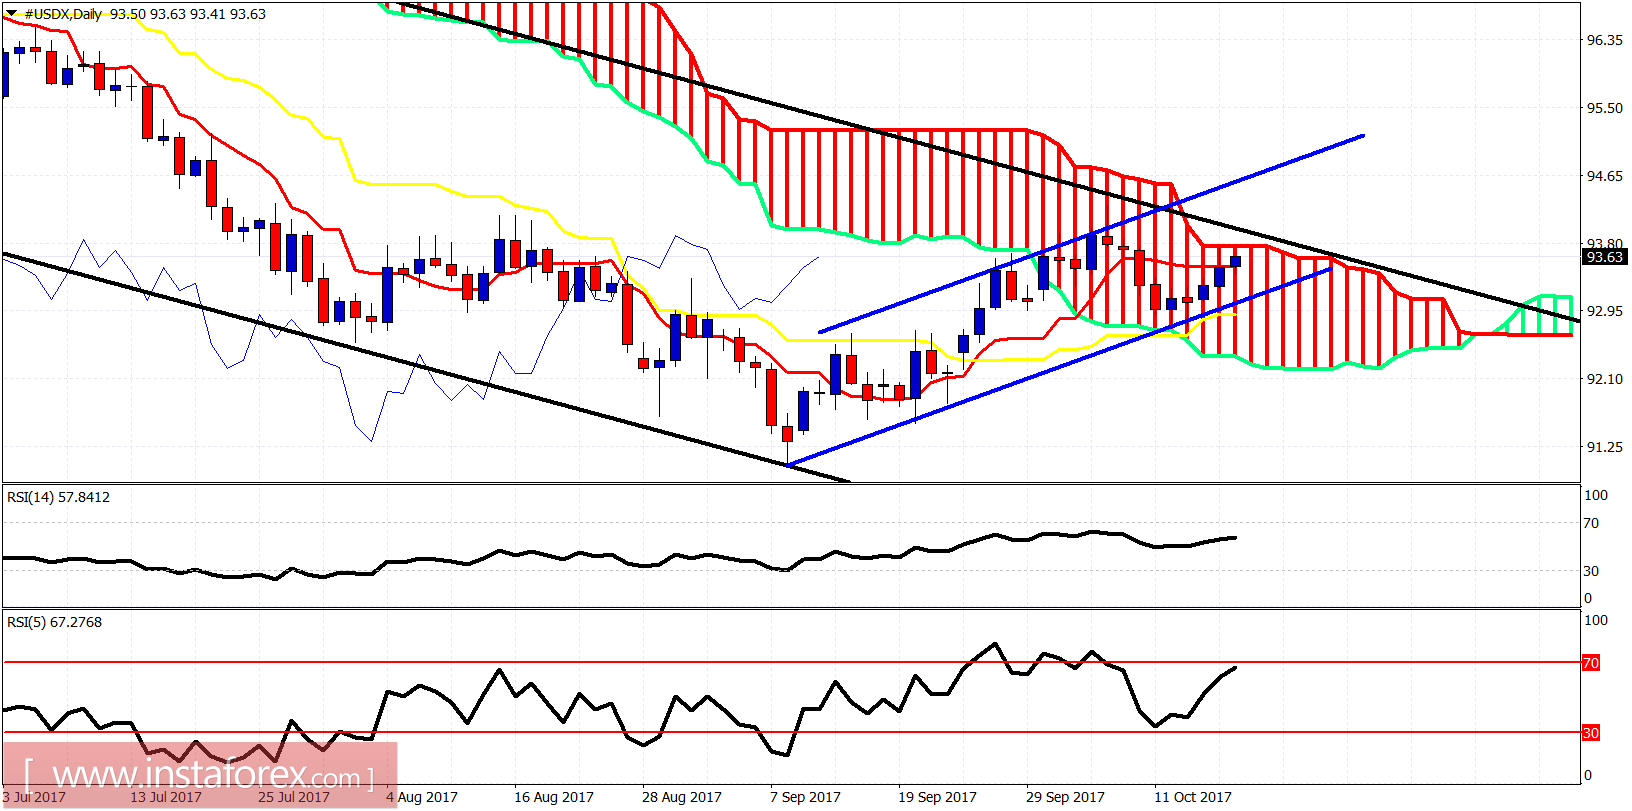
On a daily basis, we are currently inside the Kumo (cloud) implying trend is neutral. Price is trying to break above the black longer-term bearish channel while trading inside the short-term bullish channel. Support is at 93 while resistance is at 94. Breaking above 94 will increase the chances of a bigger bounce in play for the index.


