


GBP/USD managed to recover from Friday's lows and now it's challenging the 200 SMA at H1 chart, in an effort to resume the bullish bias for the short-term. Such moving average could act as dynamic resistance and if it breaks above that area, we can expect gains toward the 1.3309 level. MACD indicator is turning overbought, calling for a pullback.
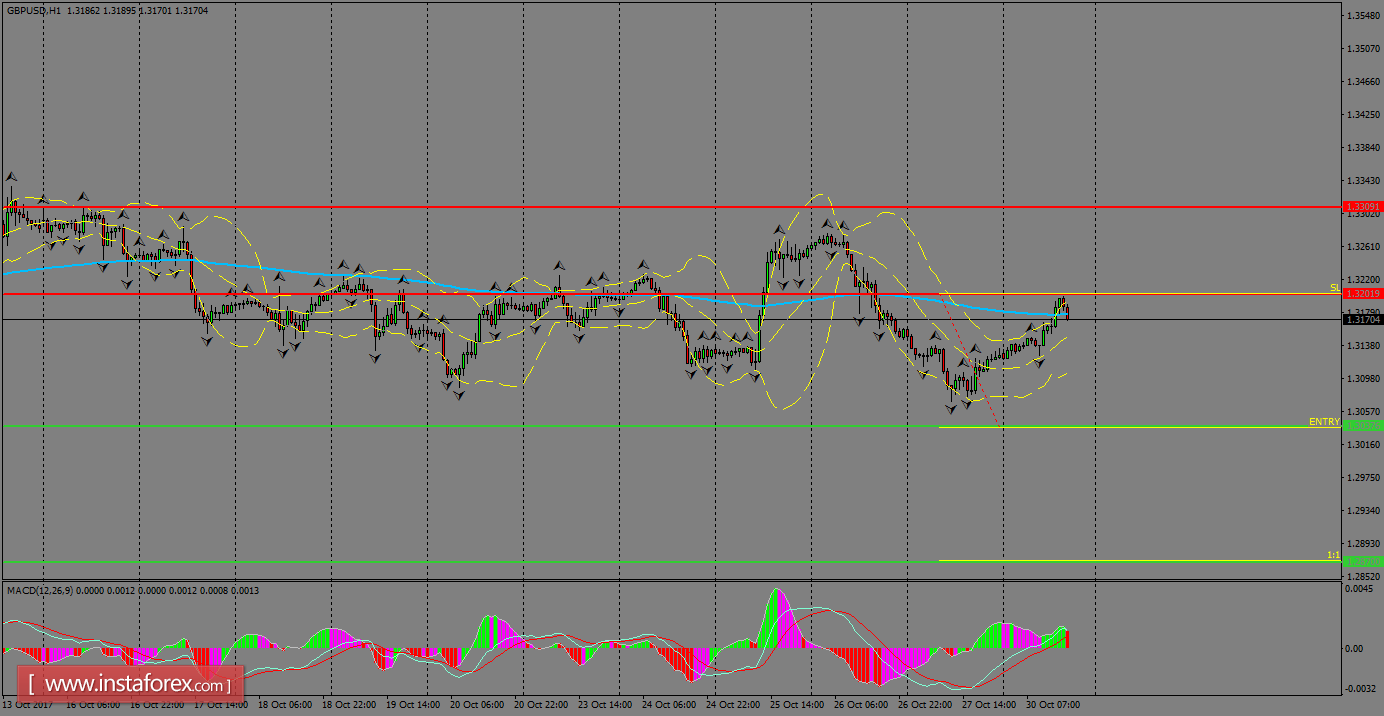
H1 chart's resistance levels: 1.3201 / 1.3309
H1 chart's support levels: 1.3037 / 1.2870
Trading recommendations for today: Based on the H1 chart, sell (short) orders only if the GBP/USD pair breaks a bearish candlestick; the support level is at 1.3037, take profit is at 1.2870 and stop loss is at 1.3201.


