


USDX remains supported by the 94.60 level and still awaits for a catalyst that resumes the bullish bias. The resistance zone of 95.14 is capping the upside in the index and if it gives up, then we might expect another rally attempt to test the 95.85 level, while to the downside, nearest support is the 200 SMA at H1 chart.
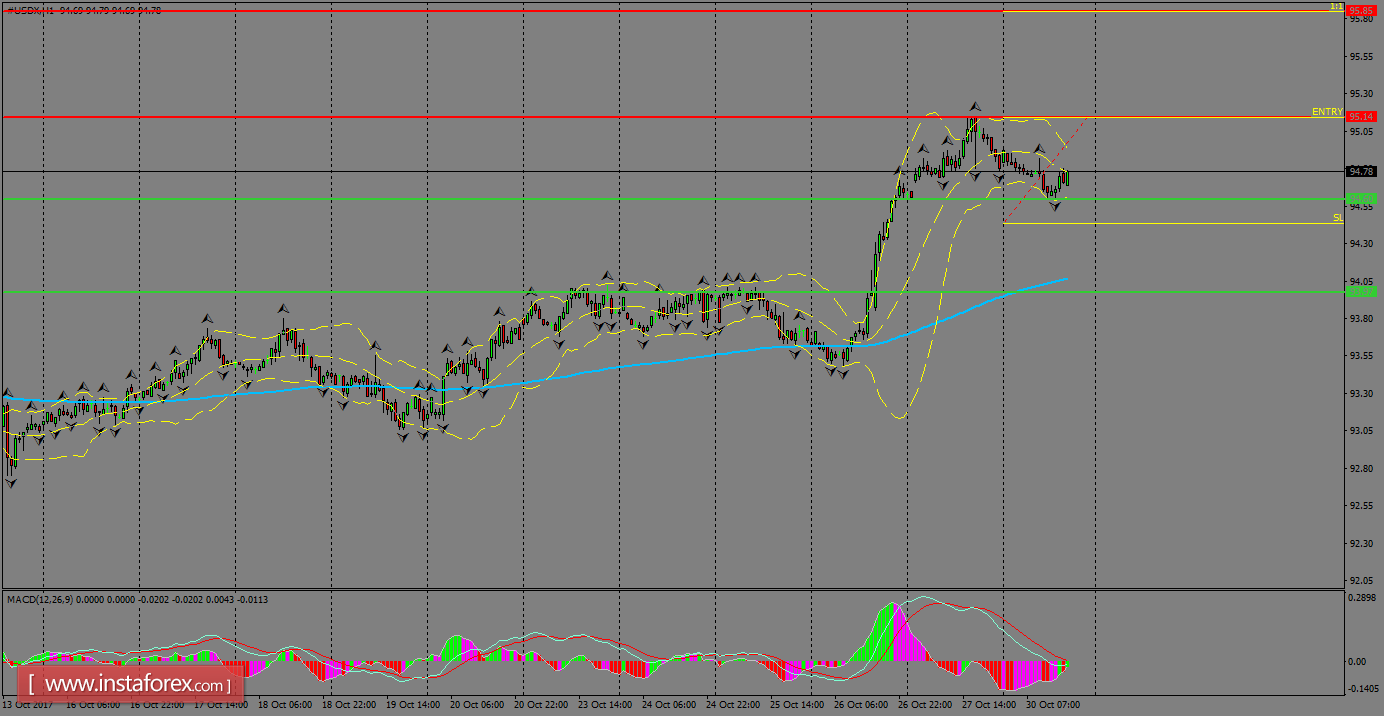
H1 chart's resistance levels: 95.14 / 95.85
H1 chart's support levels: 94.60 / 93.97
Trading recommendations for today: Based on the H1 chart, place buy (long) orders only if the USD Index breaks with a bullish candlestick; the resistance level is at 95.14, take profit is at 95.85 and stop loss is at 94.47.


