


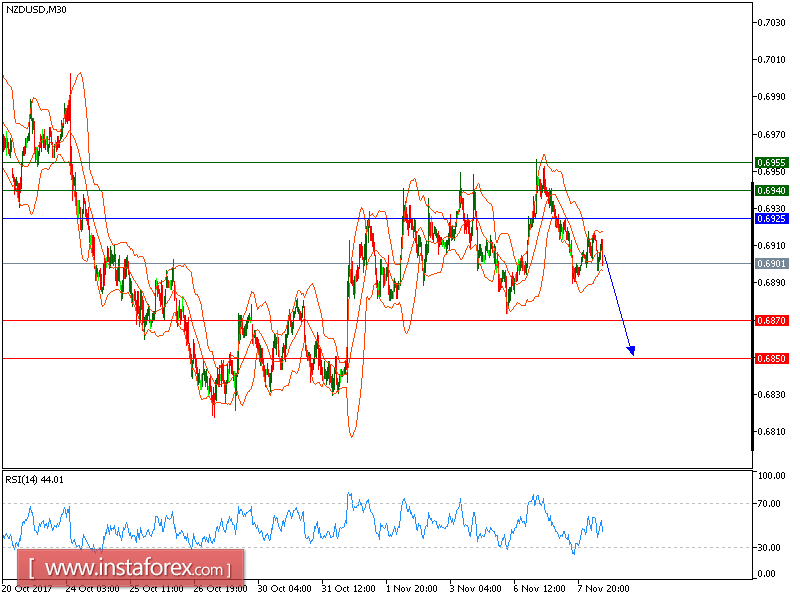
NZD/USD is expected to trade with a bearish outlook as the key resistance is at 0.6925. Despite the recent rebound from 0.6890 (the low of November 7), the pair is capped by a declining 50-period moving average. The upward potential is likely to be limited by the resistance at 0.6950.
To sum up, as long as this key level is not surpassed, look for another downside with targets at 0.6870 and 0.6850 in extension.
The black line shows the pivot point. Currently, the price is above the pivot point, which indicates long positions. If it remains below the pivot point, it will indicate short positions. The red lines are showing the support levels and the green line is indicating the resistance levels. These levels can be used to enter and exit trades.
Resistance levels: 0.6940, 0.6955, and 0.6990
Support levels: 0.6870, 0.6850, and 0.6805


