


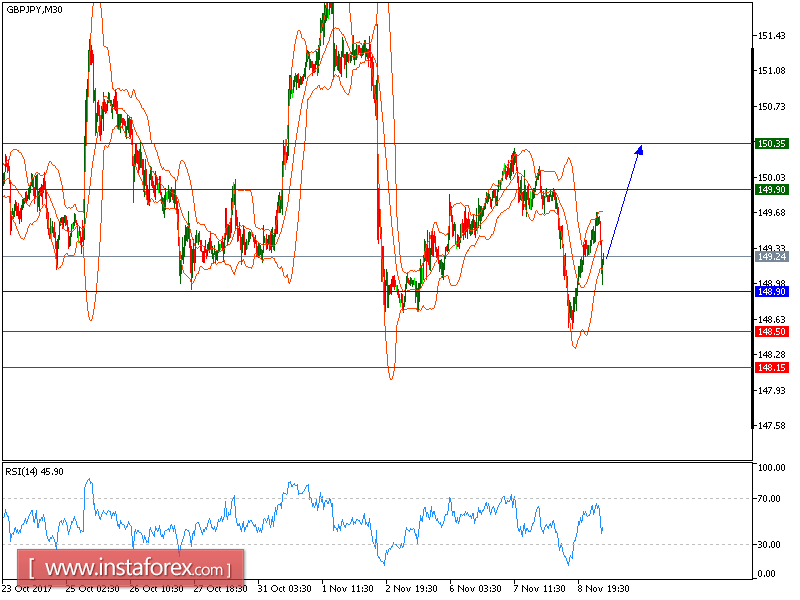
GBP/JPY is expected to continue the upside movement. The pair posted a strong rebound last night, and is now above its 20-period and 50-period moving averages. The relative strength index has reversed up, and is displaying strong bullish momentum.
In which case, as long as 148.90 holds on the downside, look for a continuation of the rebound to 149.90 and 150.35 in extension.
Alternatively, if the price moves in the direction opposite to the forecast, a long position is recommended above 148.90 with the target at 148.50.
Strategy: BUY, Stop Loss: 150.30, Take Profit: 149.30
Chart Explanation: the black line shows the pivot point. The price above the pivot point indicates long positions; and when it is below the pivot points, it indicates short positions. The red lines show the support levels and the green line indicates the resistance levels. These levels can be used to enter and exit trades.
Resistance levels: 149.90, 150.35 and 151.00
Support levels: 148.50, 148.15, and 147.45


