


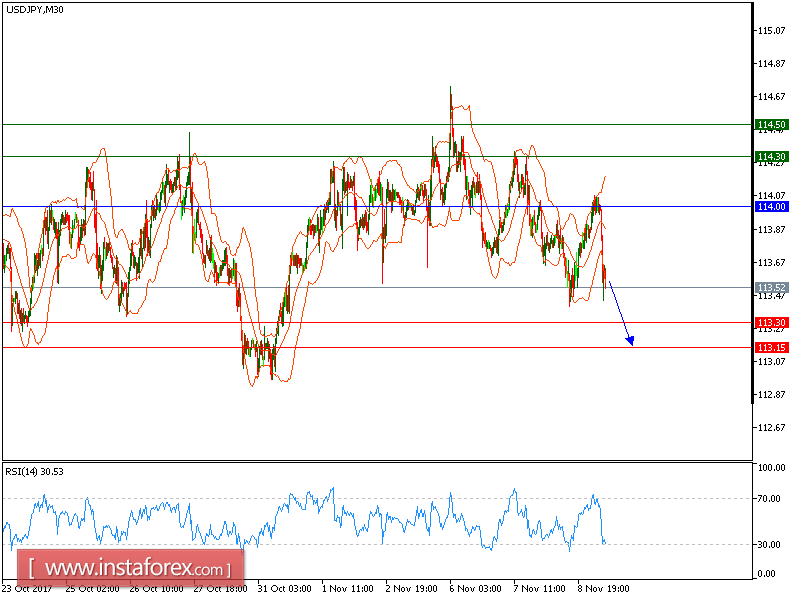
Our first target which we predicted in yesterday's analysis has been hit. USD/JPY is still expected to trade in a lower range. Despite the pair posting a rebound, the upward potential is likely to be limited by the resistance at 114.00. The declining 50-period moving average is playing a resistance role. The relative strength index is below its neutrality level at 50.
To sum up, below 114.00, look for a further decline with targets at 113.30 and 113.15 in extension.
Alternatively, if the price moves in the opposite direction, a short position is recommended above 114.00 with a target at 114.30.
Chart Explanation: The black line shows the pivot point. The current price above the pivot point indicates a bullish position, while the price below the pivot point is a signal for a short position. The red lines show the support levels and the green line indicates the resistance level. These levels can be used to enter and exit trades.
Strategy: SELL, Stop Loss: 114.00, Take Profit: 113.30
Resistance levels: 114.30, 114.50 and 114.90 Support Levels: 113.65, 11.30, 112.95


