Main Quotes Calendar Forum
flag

FX.co ★ Ichimoku cloud indicator analysis of gold for December 15, 2017

parent
Forex Analysis:::2017-12-15T08:01:11

Ichimoku cloud indicator analysis of gold for December 15, 2017

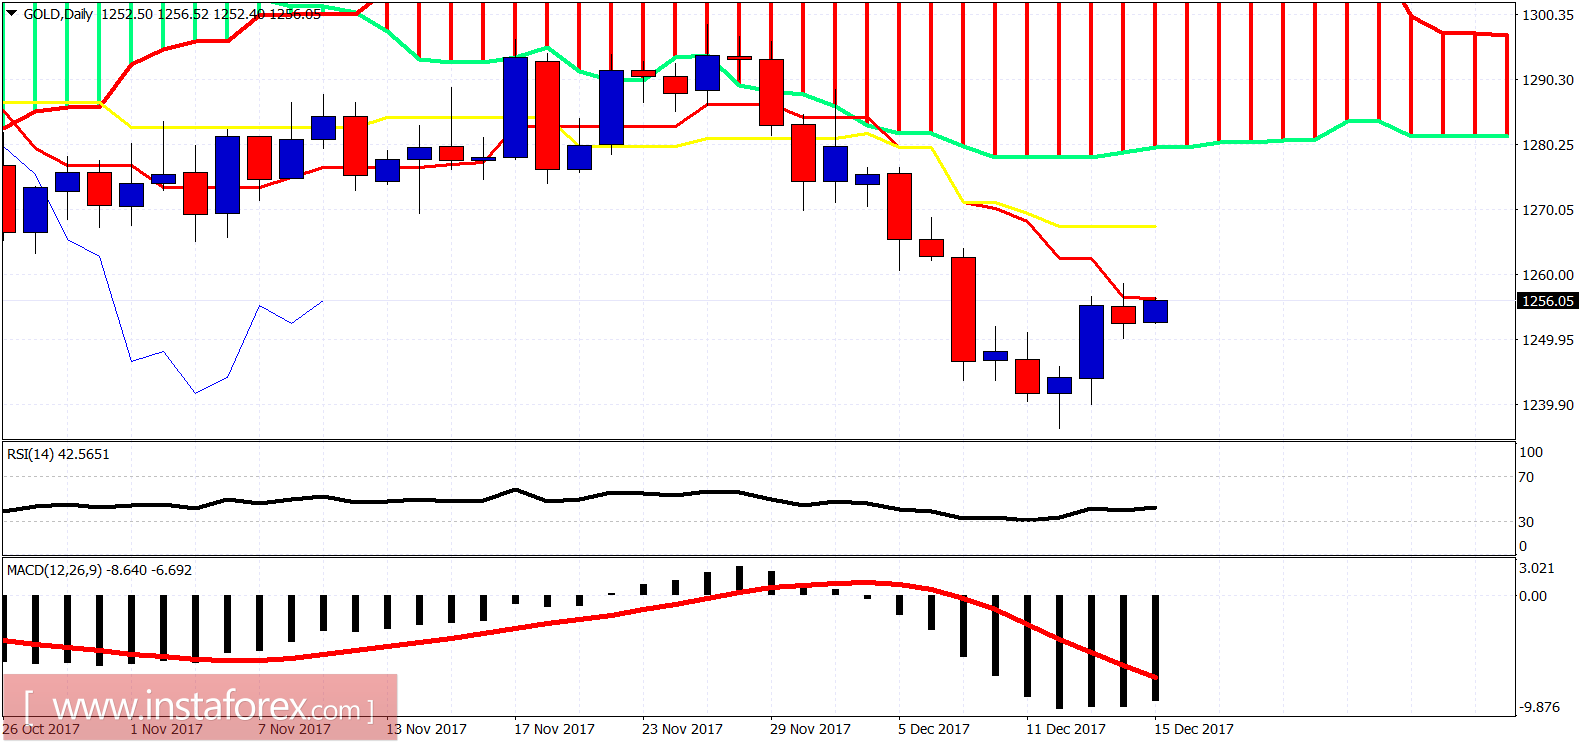
Gold price is trading near its weekly highs after bouncing from $1,237. We warned Gold bears that a bounce towards cloud resistance was coming. The market delivered what was expected. Now Gold is being tested at important short-term resistance.

Ichimoku cloud indicator analysis of gold for December 15, 2017

Red lines - bearish channel

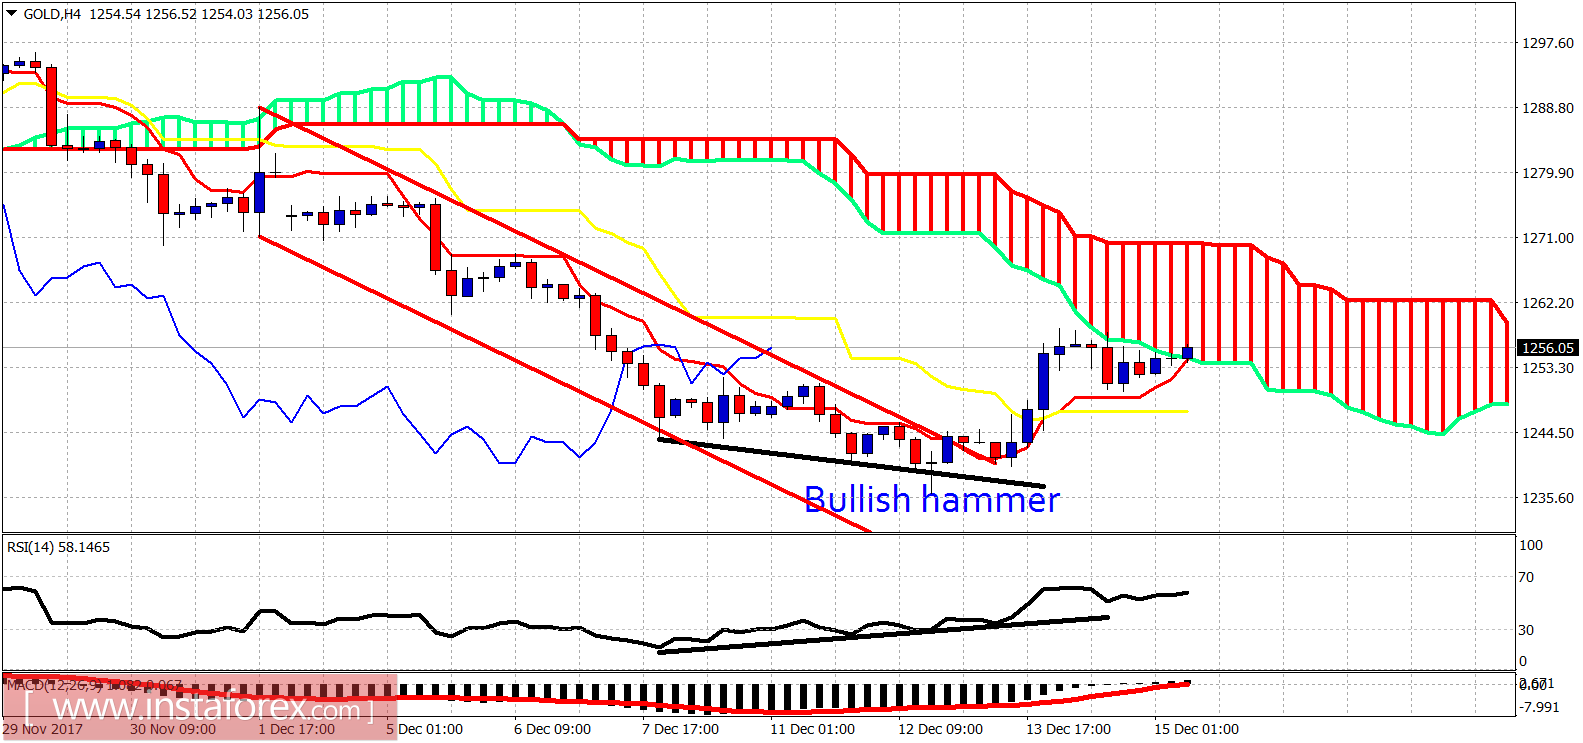
Gold price has bounced as expected, because price broke out of the bearish channel and the RSI was giving bullish divergence signs. Gold price has reached the bounce target at the 4-hour Kumo (cloud) resistance. A rejection here will most probably push Gold price towards $1,200. Support is at $1,250 and next at $1,246.

Ichimoku cloud indicator analysis of gold for December 15, 2017

On a daily basis, Gold price is testing the tenkan-sen (red line indicator). A daily close above it will open the way for a move towards the kijun-sen (yellow line indicator) at $1,268. Daily trend remains bearish and this upward move is still considered as a bounce. I prefer to be neutral at the current levels or slightly bearish if price breaks below $1,250.
Analyst InstaForex
Share this article:
parent
loader...
all-was_read__icon
You have watched all the best publications
presently.
We are already looking for something interesting for you...
all-was_read__star
Recently published:
loader...
More recent publications...