


The Dollar index pulled back towards our short-term target and Ichimoku cloud support. Price is bouncing after the post FOMC decline. There are a lot of chances that the pullback is over and a new leg upwards has already started.
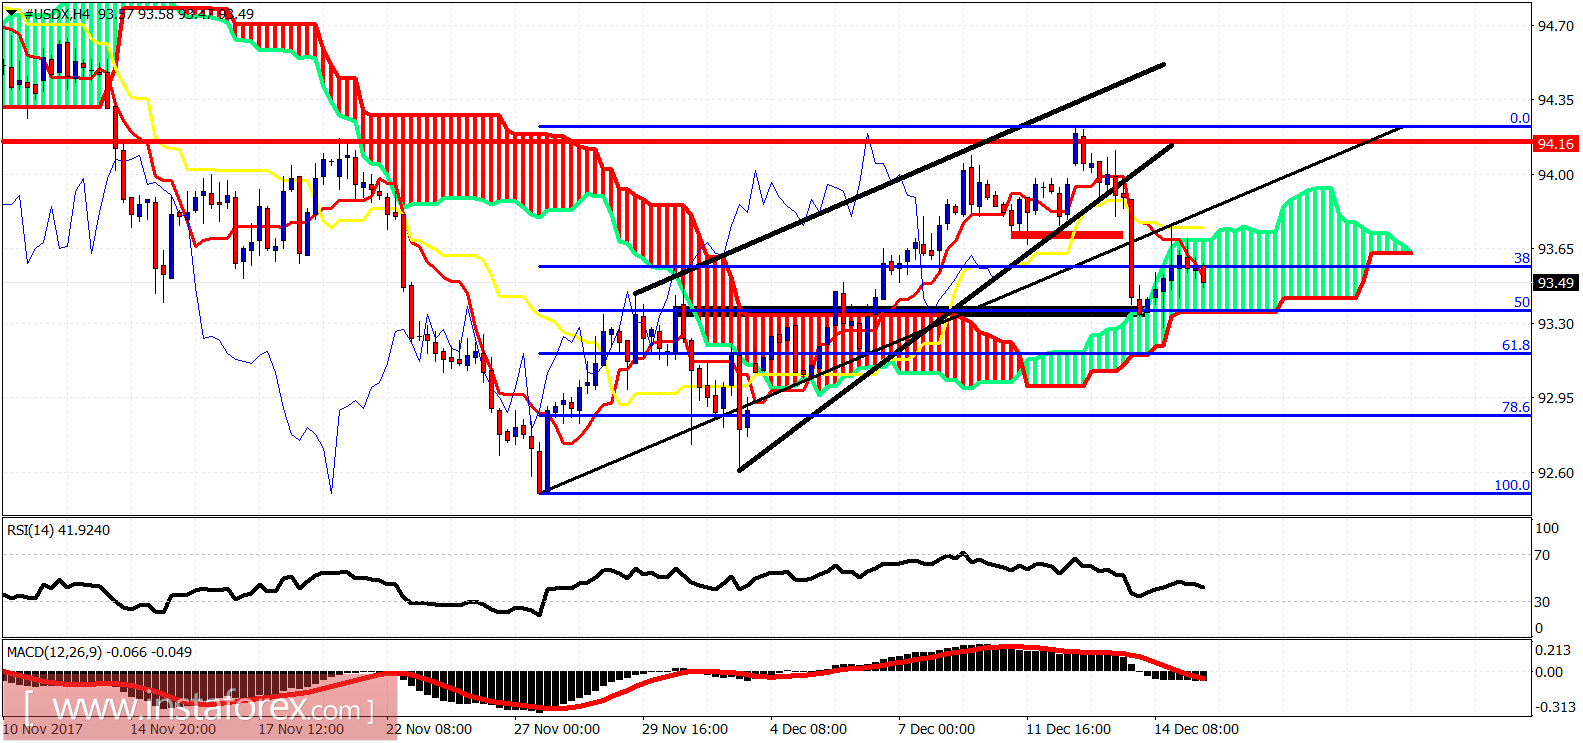
Black rectangle - target area
Red rectangle - support area (broken)
The Dollar index reached the black rectangle target area after price broke out of the upward sloping wedge and the red rectangle support. Price has found support at the 4-hour Kumo. Resistance is at 93.75 and next at 94.15 where we got rejected during the FOMC on Wednesday. Support is at 93-93.30.
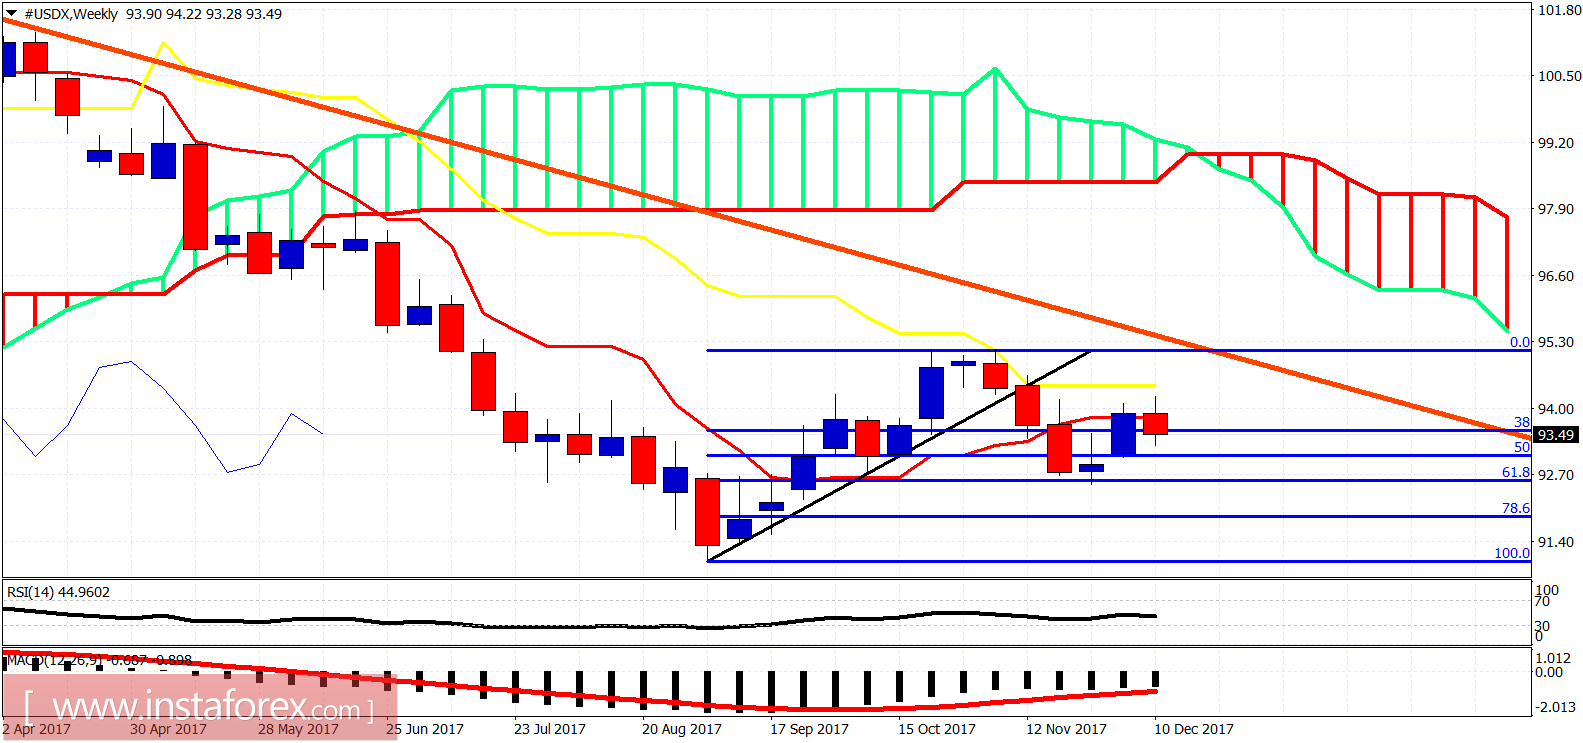
The Dollar index got rejected at the weekly kijun-sen (yellow line indicator). A break above this week's high will be a bullish sign confirming my view that the Dollar index is heading towards 96-97. Support is 92.50-93 area. A break below that level will be very bearish for the index.


