


Gold price is in a bearish short-term trend as price is below both the tenkan- and kijun-sen indicators. Gold is making lower lows and lower highs and is expected to move towards $1,300-$1,280 area once we break below $1,307.
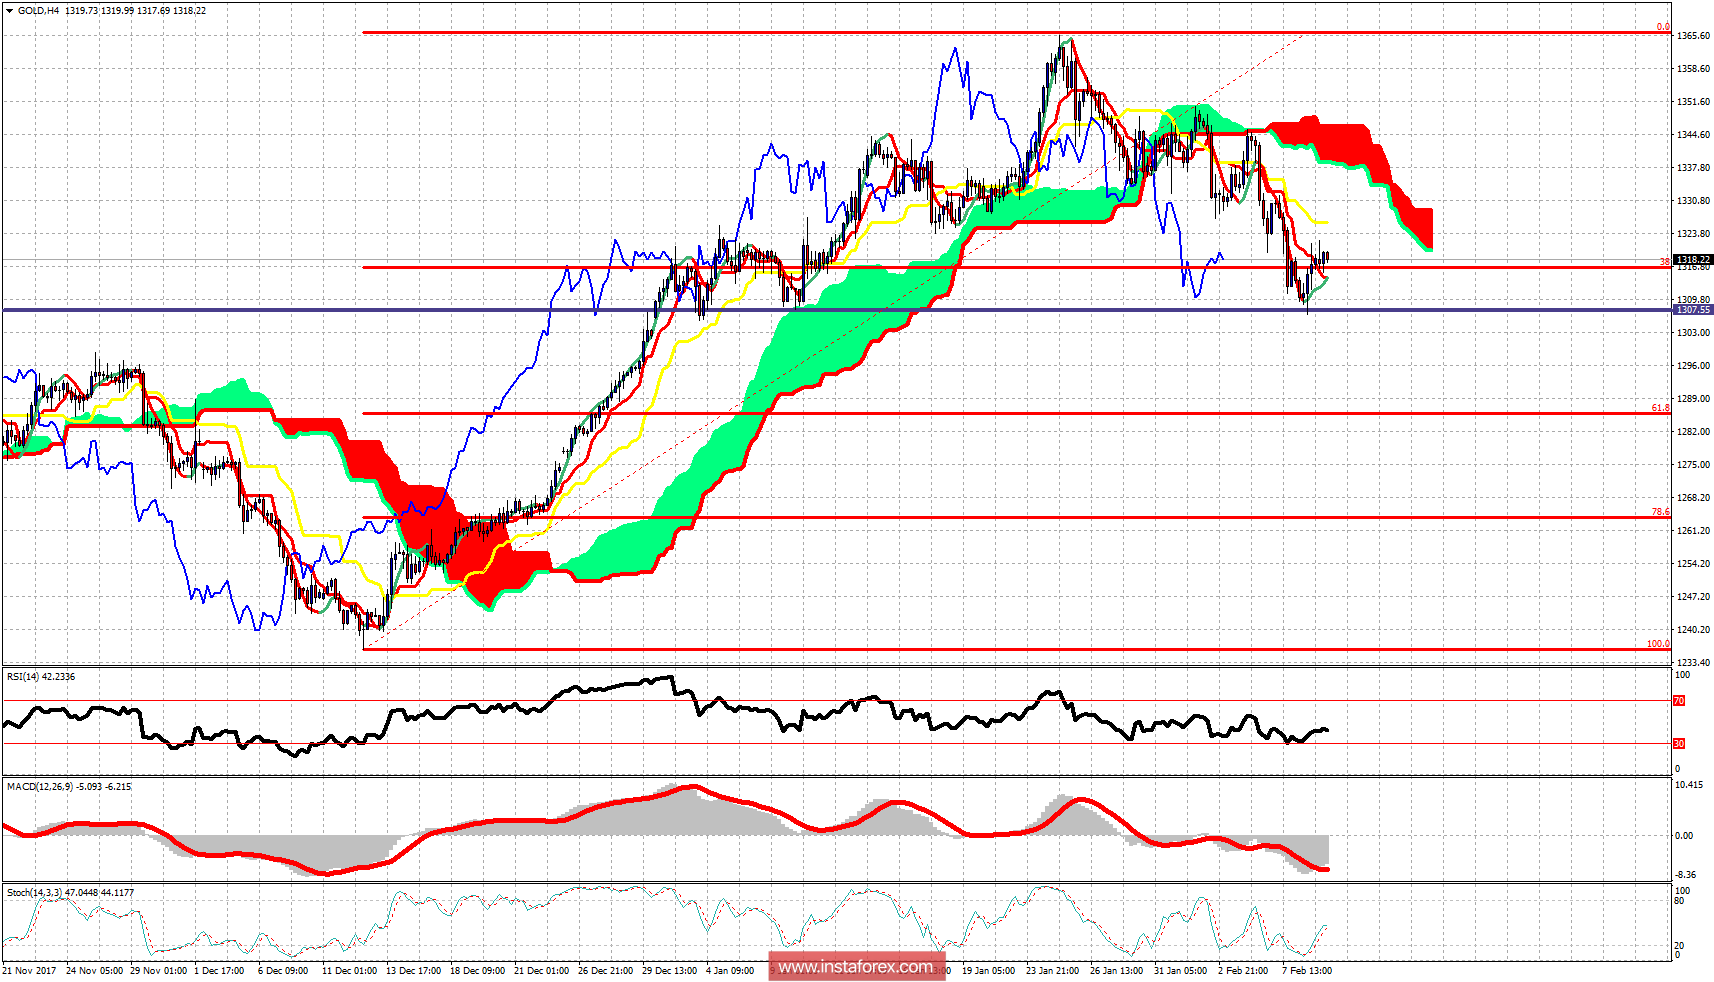
Despite the risk off sentiment in equity markets and the weak Dollar, Gold looks like it has made an important top at the $1,365 level. The rejection at the long-term resistance was not a good sign. Gold price has turned short-term trend to bearish and will remain bearish as long as price is below the 4 hour Kumo. Resistance is at $1,338-47. Gold is trading around the 38% Fibonacci retracement of the entire rise since December lows. At $1,307 we also find the horizontal support at $1,307. If price makes a new lower low, I would expect Gold to move even lower towards $1,300-$1,280.
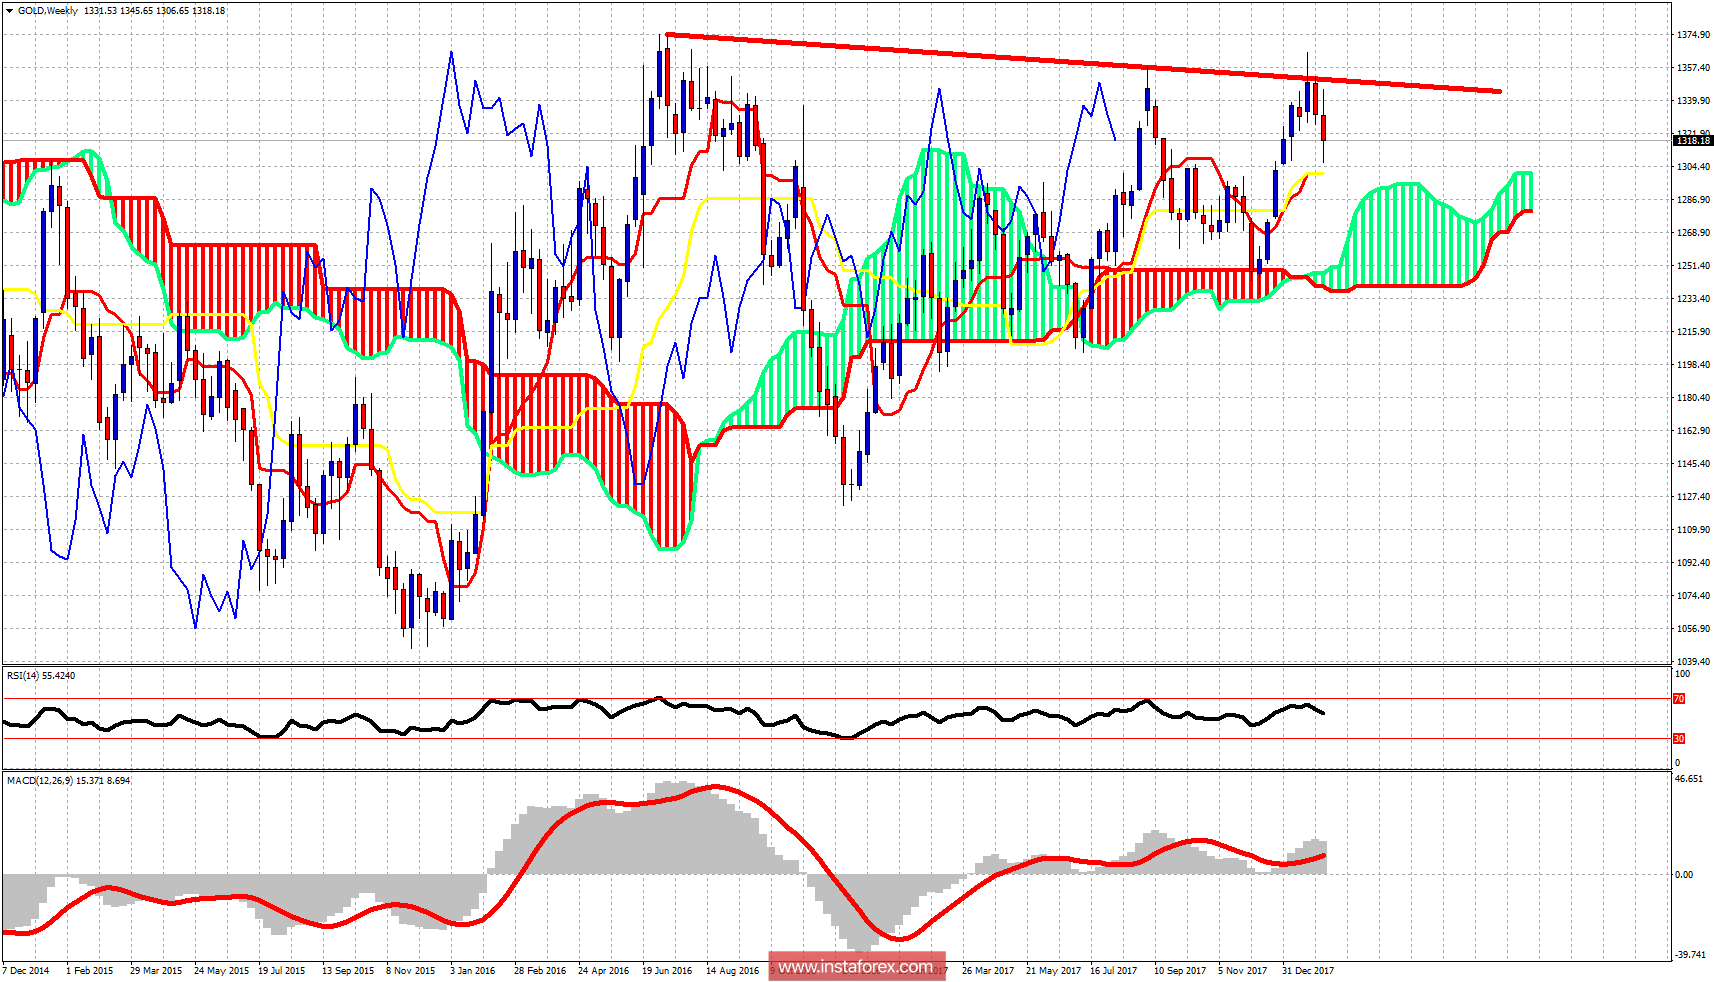
On a weekly basis, Gold got rejected at the resistance trend line and is going to test the weekly Kijun-sen at $1,300. A weekly close below $1,300 will open the way for a move towards the cloud support at $1,270 and even lower.


