


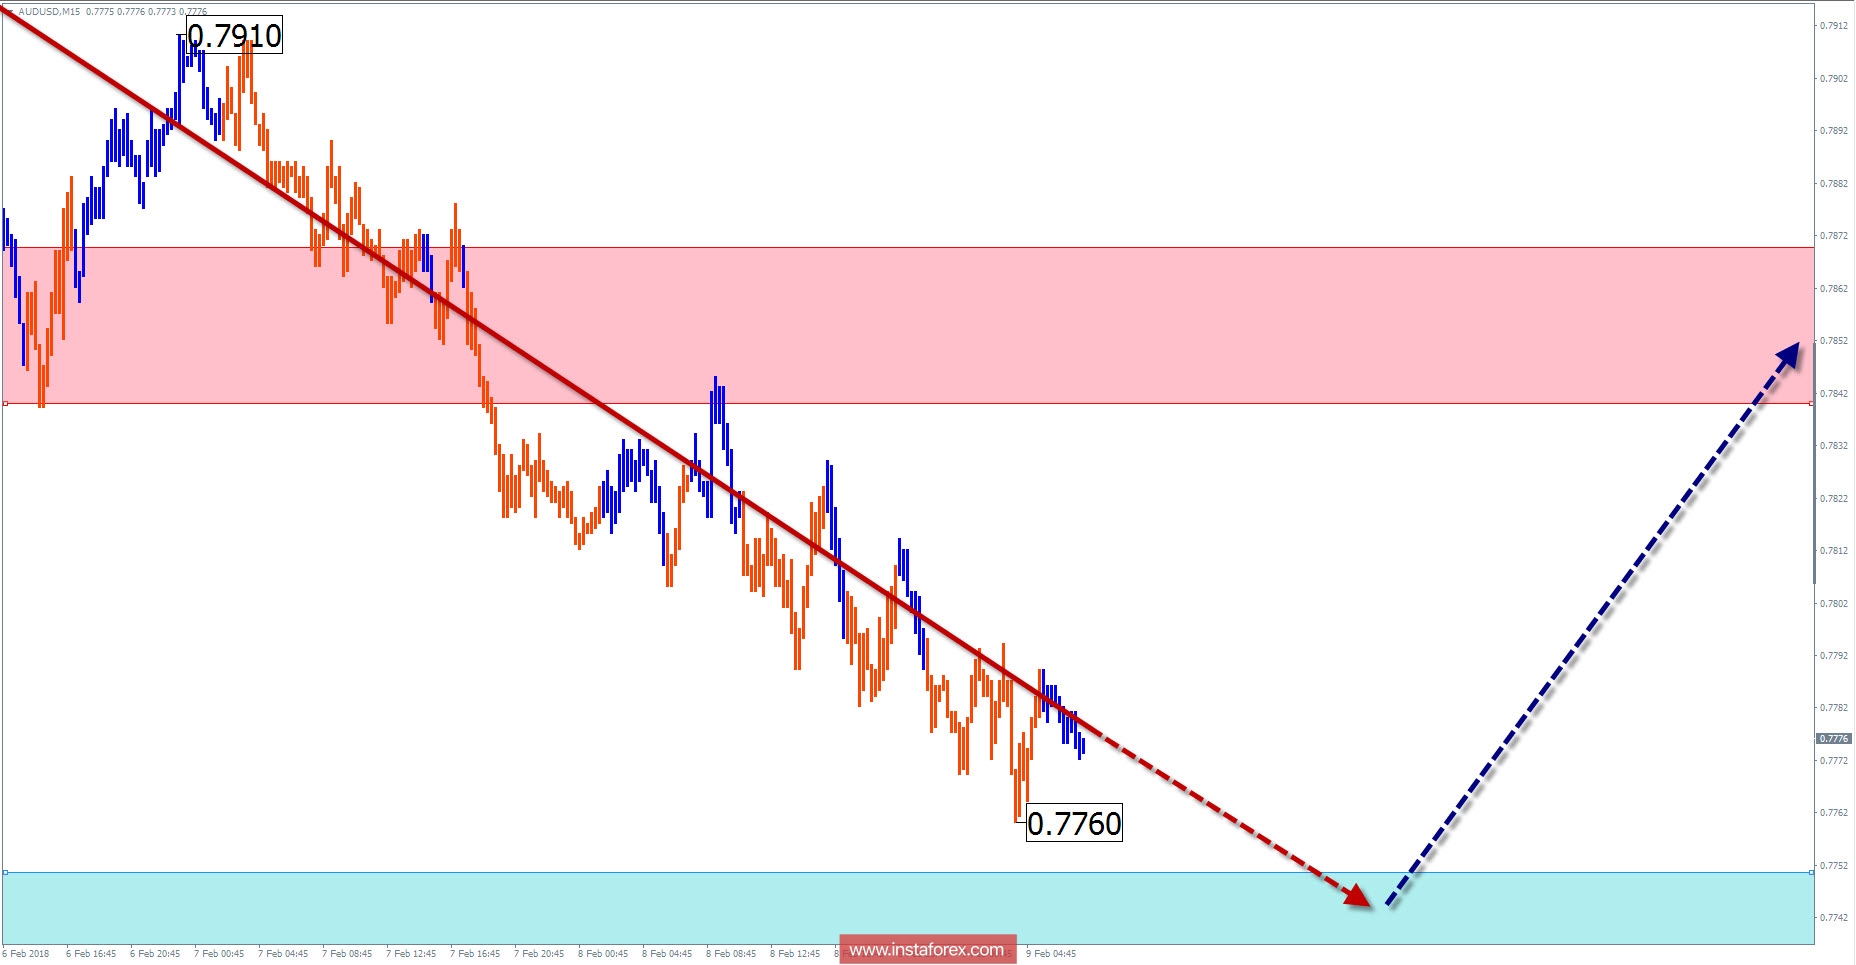
Review and forecast for AUD / USD pair
At the end of the rising wave, the main pair of the Australian currency formed a counter wave structure, which sets the trend for the entire last year. Last year, the wave was established in the form of a shifting plane that started on September 8. The final section (C) to the current day reached the minimum allowable elongation starting a week ago. Formally, the correction wave can end at the current price levels. Nevertheless, the main direction of the inter-trend trend will be a decline until the emergence of clear signals of a change in the exchange rate.
In the upcoming trading sessions, The level of the nearest support should give rise to a counter price rise. The expected upper limit of the daily volatility range s indicated by the resistance boundary.
Boundaries of resistance zones:
- 0.7840 / 70
Boundaries of support zones:
- 0.7750 / 20
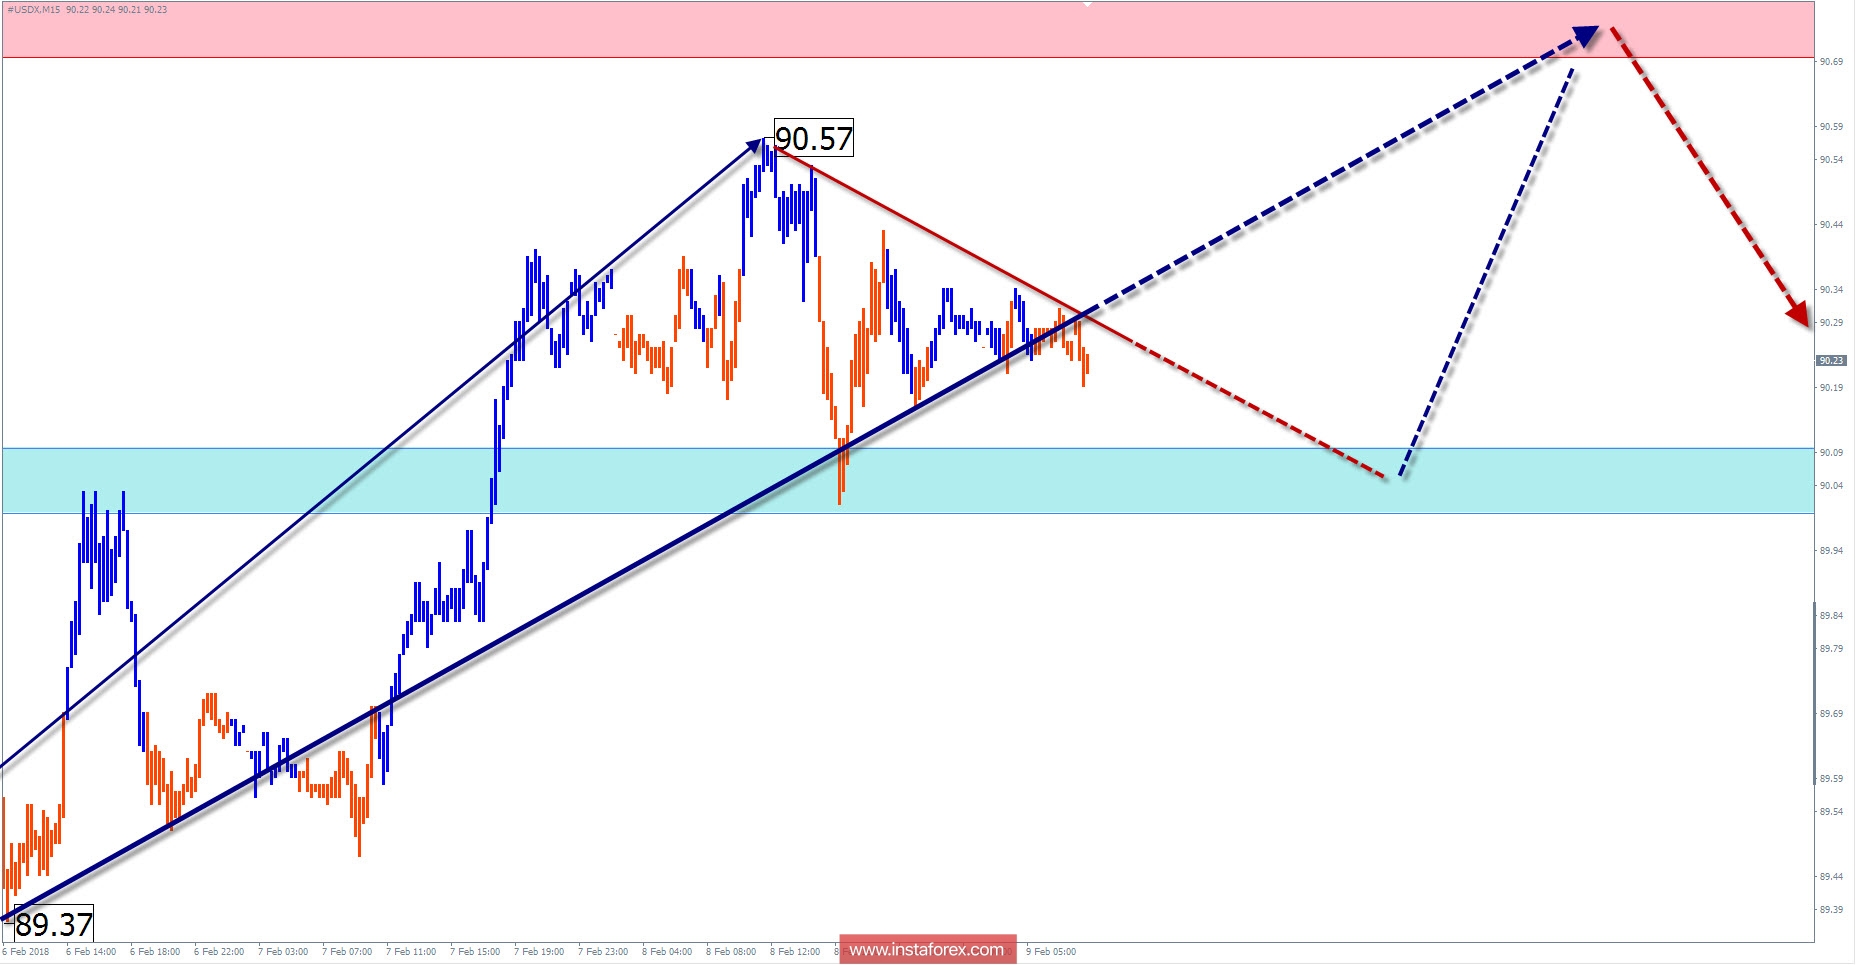
Overview and Outlook for #USDX (US Dollar Index)
On the daily scale of the index chart, the formation of the descending stretched plane continues. At the beginning of last year, there was a change of parts in the model, with the end of the middle part (B) and the beginning of the final (C). The subsequent active decline in the dollar quotations is consistent with the impulsive nature of the final part. The structure of the whole wave is not completed, which opens the possibility of the current trend to continue at least up to the nearest control area.
In the framework of the described trend, a counter-corrective patch was formed from January 25. The ascending zigzag is nearing completion. Within the framework of the calculated resistance zone, the completion of the recovery and the formation of conditions for a turn are expected today. The beginning of the decline is more likely at the end of the day or the next trading week.
Boundaries of resistance zones:
- 90.70 / 80
Boundaries of support zones:
- 90.10 / 90.00
Explanations of the figures:
For simplified wave analysis, a simple waveform is used that combines 3 parts namely A, B, and C. All types of correction are created and most of the impulses can be found in these waves. Every time frame is considered and the last incomplete wave is analyzed.
The areas marked on the graphs indicate the probability of a change in the direction of motion has significantly increased as calculated in the areas. Arrows indicate the wave counting following the technique used by the author. A solid background of the arrows signifying the structure has been formed while the dotted one means the expected wave motion.
Attention: The wave algorithm does not take into account the duration of the movement of tools in time. The forecast is not a trading signal! To conduct a bargain, you need to confirm the signals used by your trading systems.


