


GBP/USD had no major action during the Monday's session, but it remains steady around the 200 SMA at H1 chart. To the downside, the nearest support lies at 1.3939, where a breakout should open the doors to test the 1.3753 level. Overall, volatility should favor to the bears across the board, and the pair is expected to remain under pressure.
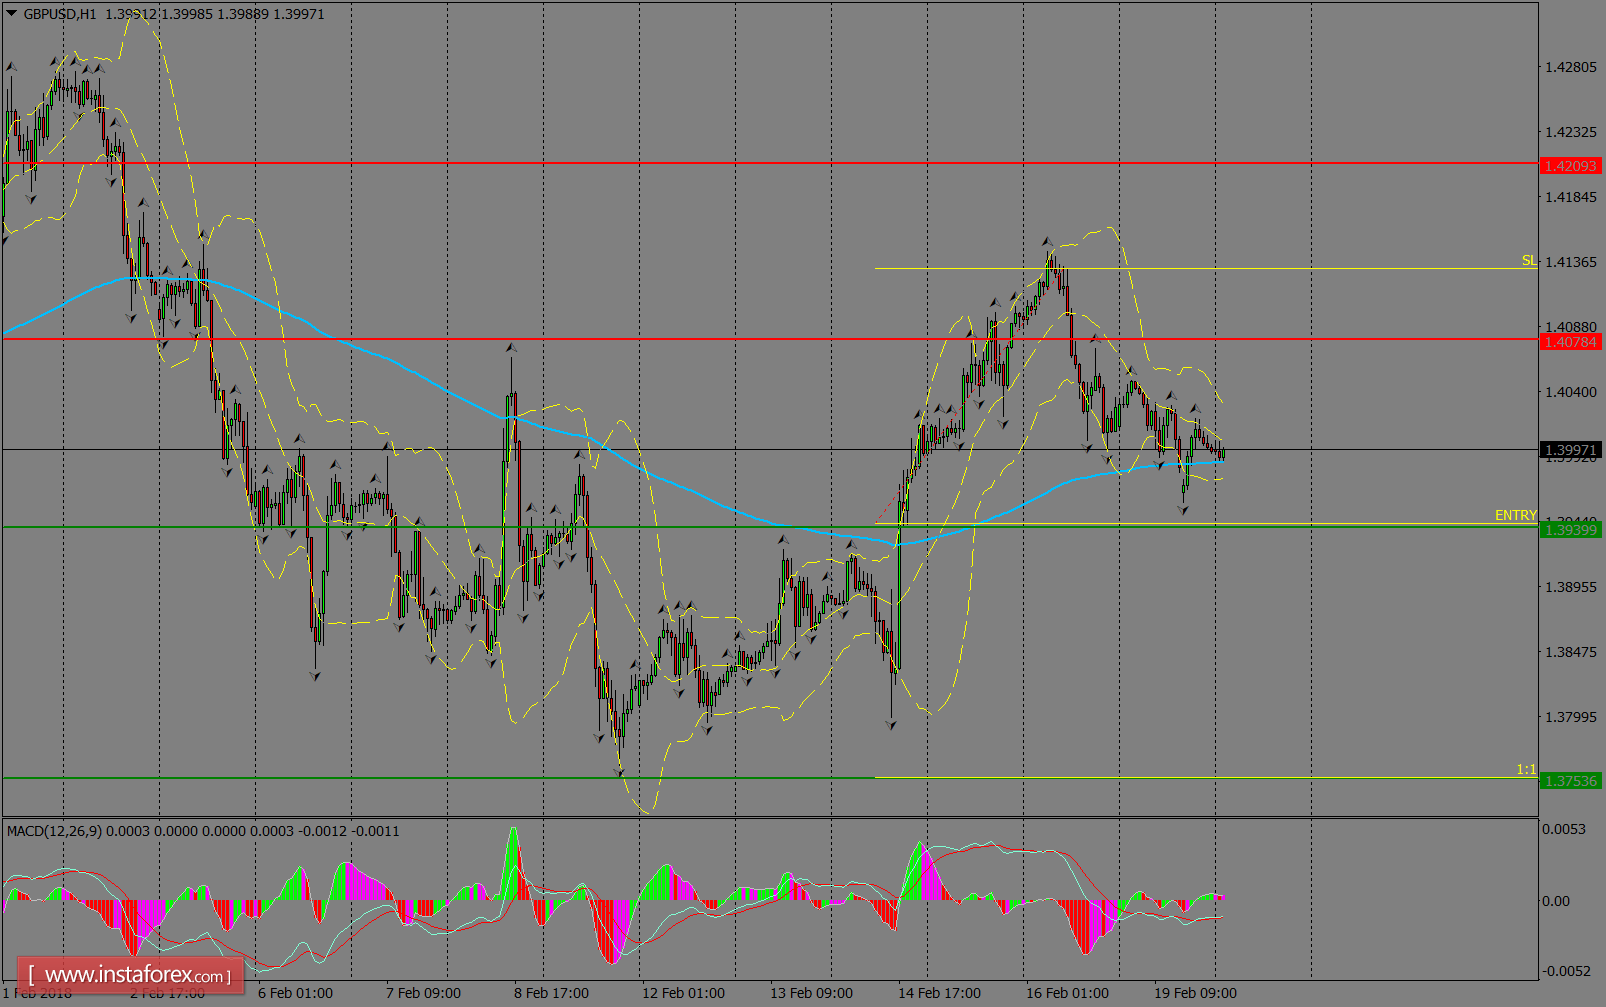
H1 chart's resistance levels: 1.4078 / 1.4209
H1 chart's support levels: 1.3939 / 1.3753
Trading recommendations for today: Based on the H1 chart, sell (short) orders only if the GBP/USD pair breaks a bearish candlestick; the resistance level is at 1.3939, take profit is at 1.3753, and stop loss is at 1.4130.


