


The index didn't manage to break above the 200 SMA at H1 chart, and it seems we could expect a pullback in order to resume the bearish trend. A fractal was formed around the 89.36 level, making a strong resistance area at the current stage. The next target to the downside is placed at 87.88.
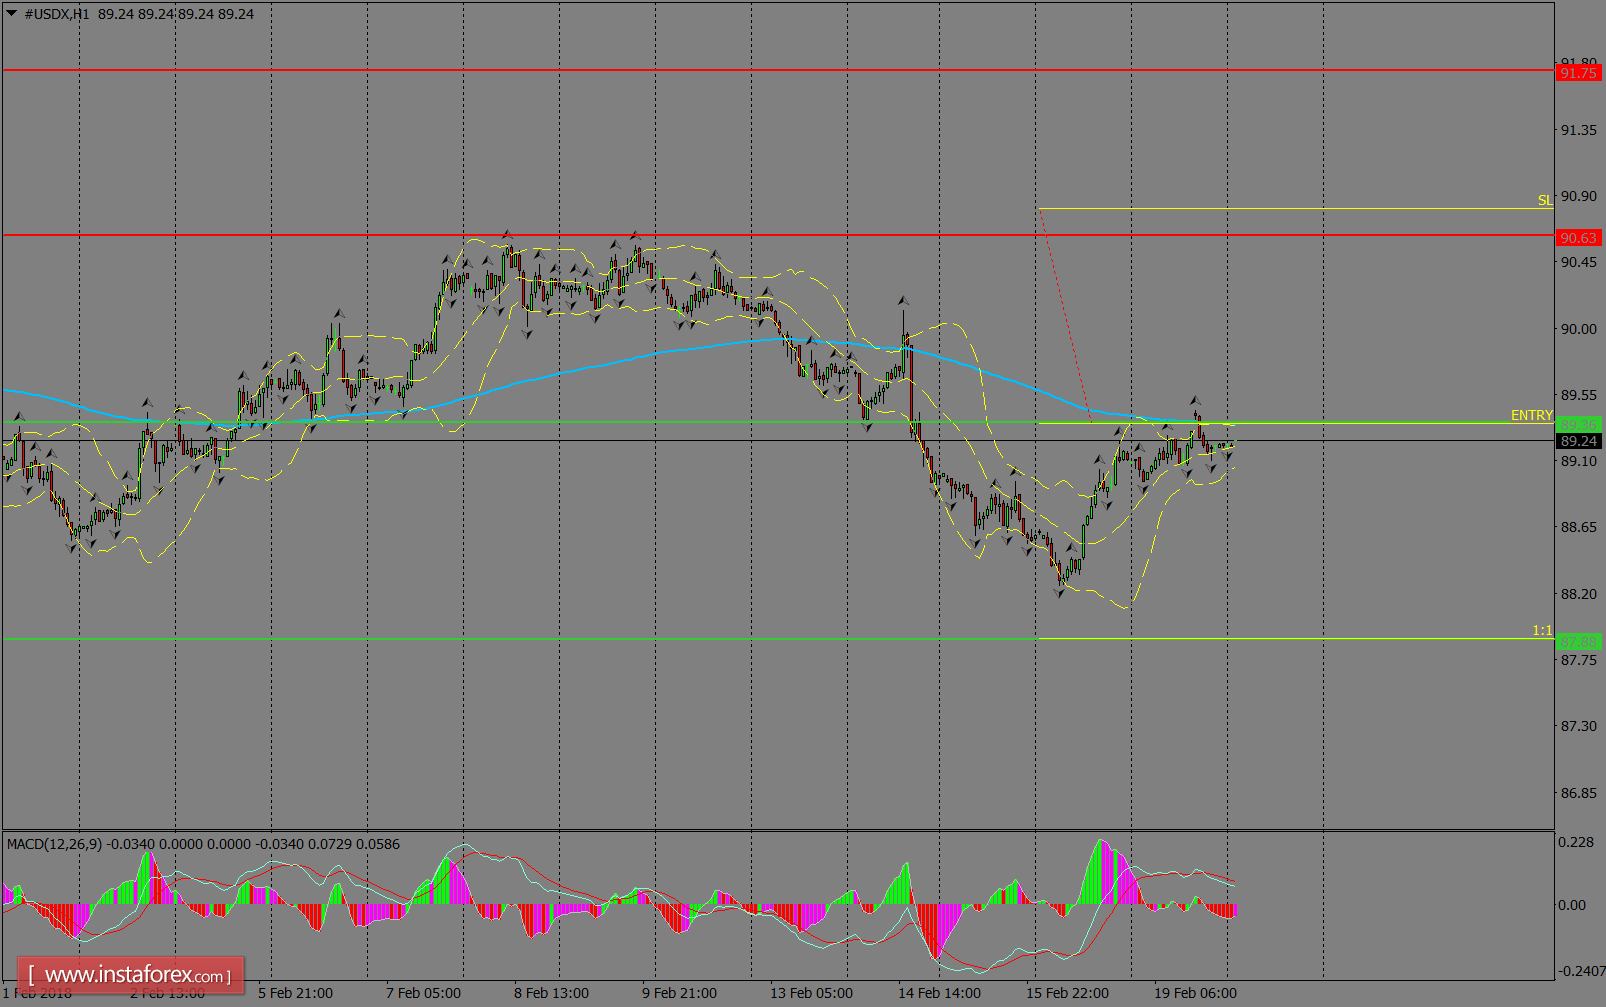
H1 chart's resistance levels: 90.63 / 91.75
H1 chart's support levels: 89.36 / 87.88
Trading recommendations for today: Based on the H1 chart, place sell (short) orders only if the USD Index breaks with a bearish candlestick; the support level is at 89.36, take profit is at 87.88, and stop loss is at 90.81.


