


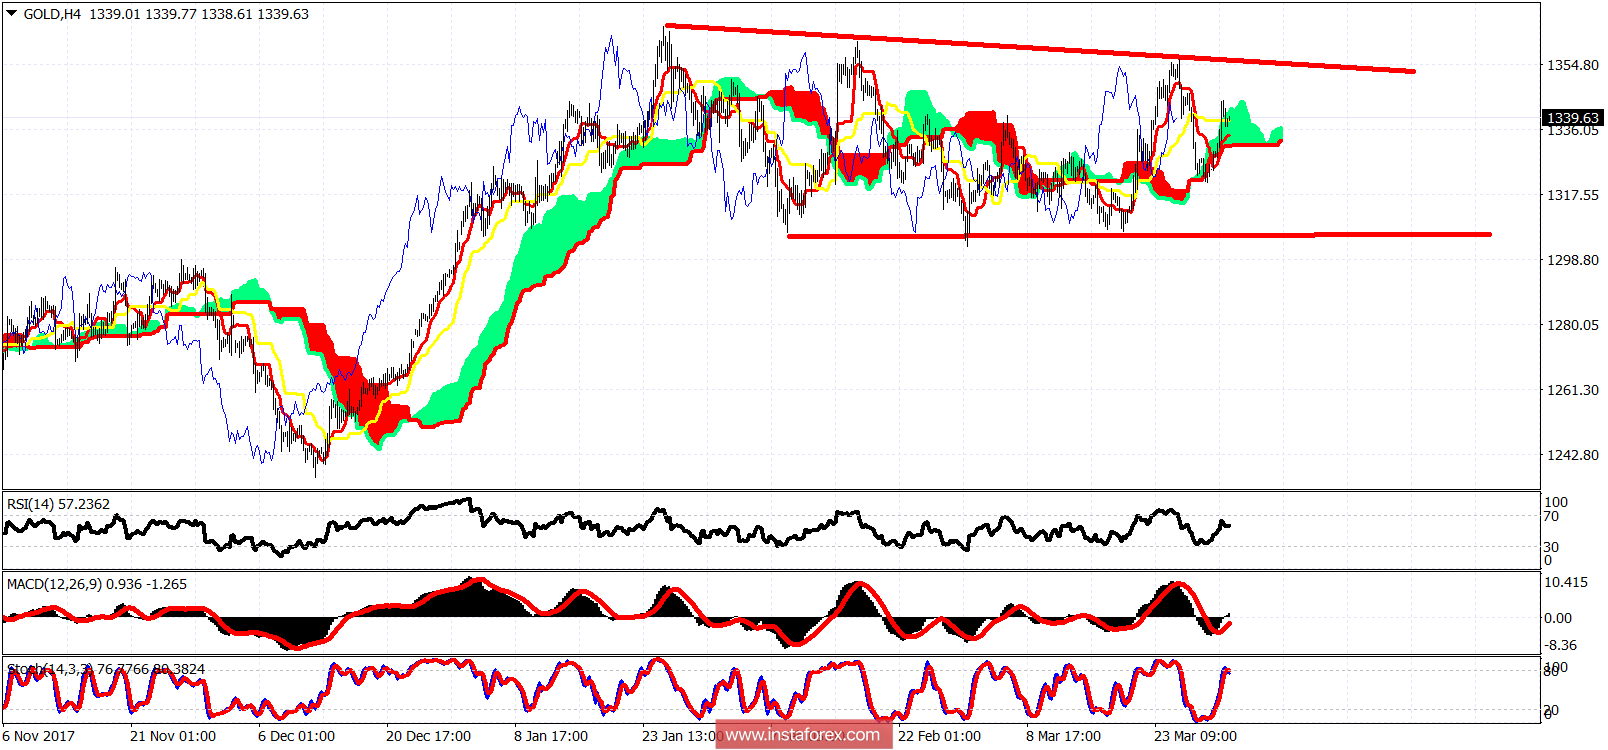
Red lines - trading range
The gold price has broken above the 4-hour Kumo once again. The price found support at the 4-hour cloud and is bouncing. Next important resistance is at $1,345 (yesterday highs) and at $1,355. A break above $1,355 will open the way for a big break out towards $1,400 and higher. Support is at $1,320. Break below it and we head towards $1,300.
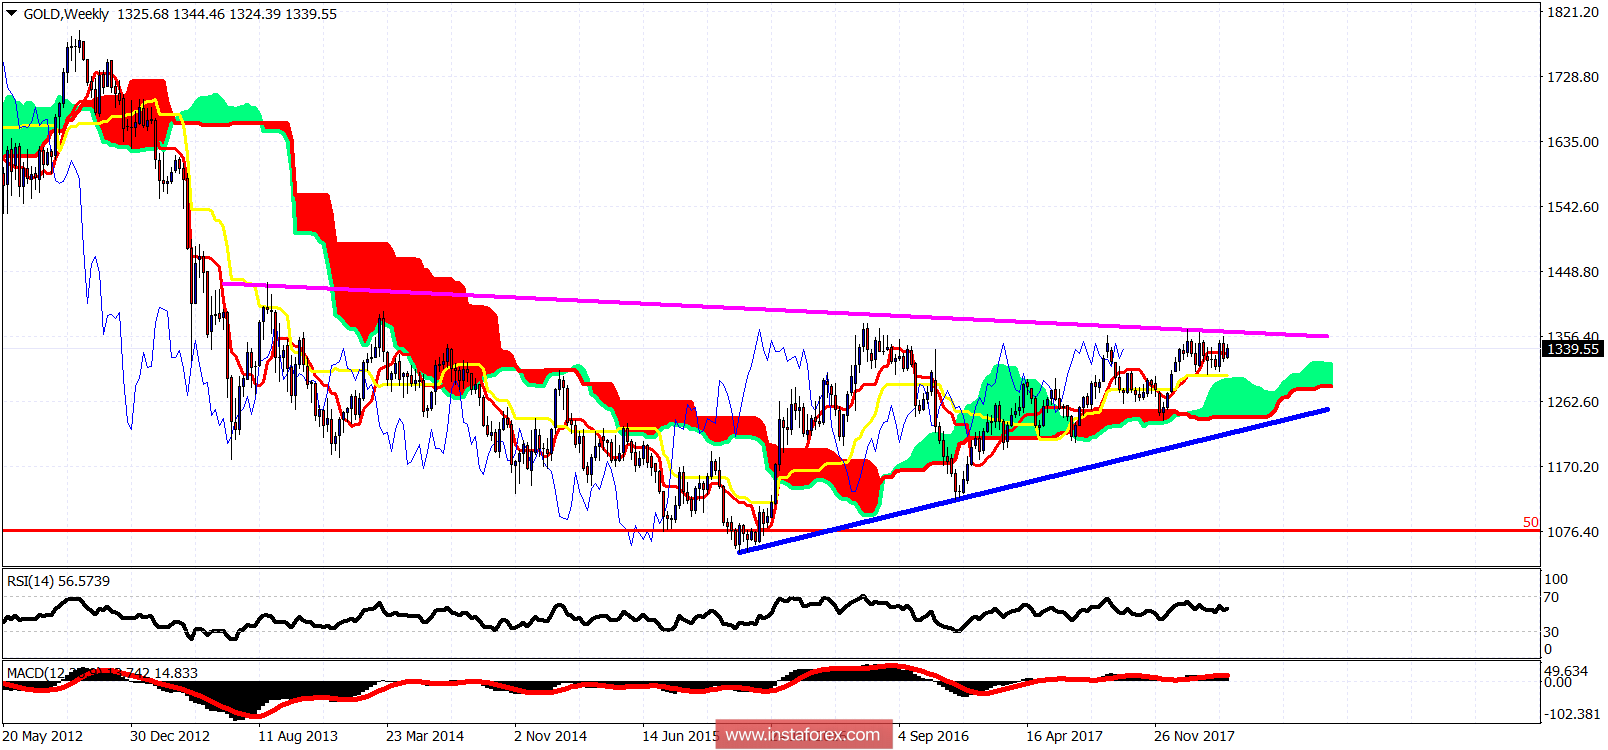
Magenta line - long-term resistance
Blue trend line -long-term support
On a weekly basis, the gold price remains below the long-term magenta trend line resistance but also above the weekly Kumo. I expect the gold price to eventually break the resistance to the upside and move towards $1,400. This scenario is still valid as long as the price is above $1,300. So any pull back is seen as a buying opportunity with stops at $1,300.


