


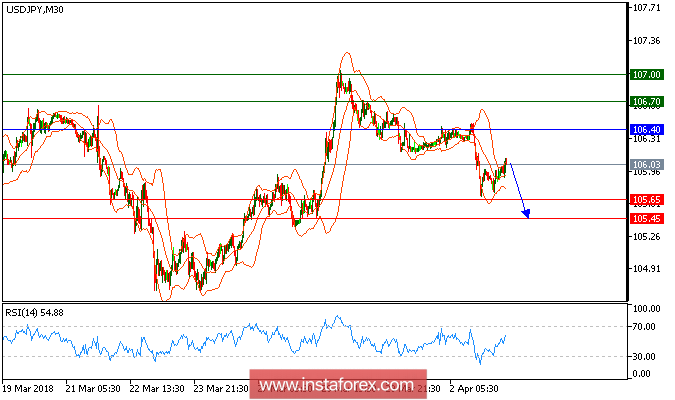
USD/JPY is expected to trade with a bearish outlook. The pair has failed to post a sustainable rebound while being capped by the descending 20-period moving average, which stands below the 50-period one. Downward momentum for the pair is also evidenced by the relative strength index, which remains subdued in the 30s. Therefore, intraday bearishness persists, and the pair is expected to return to 105.65 before sinking further toward 105.45. Key resistance is located at 106.40, a breach would open a path toward 106.70 on the upside.
Chart Explanation: The black line shows the pivot point. The present price above the pivot point indicates a bullish position, and the price below the pivot point indicates a short position. The red lines show the support levels, and the green line indicates the resistance levels. These levels can be used to enter and exit trades.
Strategy: SELL, stop loss at 106.40, take profit at 105.65
Resistance levels: 106.70, 107.00, and 107.30
Support levels: 105.65, 105.45, and 105.00.


