


The Gold price has pulled back towards $1,330 inside the 4-hour cloud. Support is held for now but there is still a chance we see a move below $1,320 before we start the next leg upwards towards $1,400.
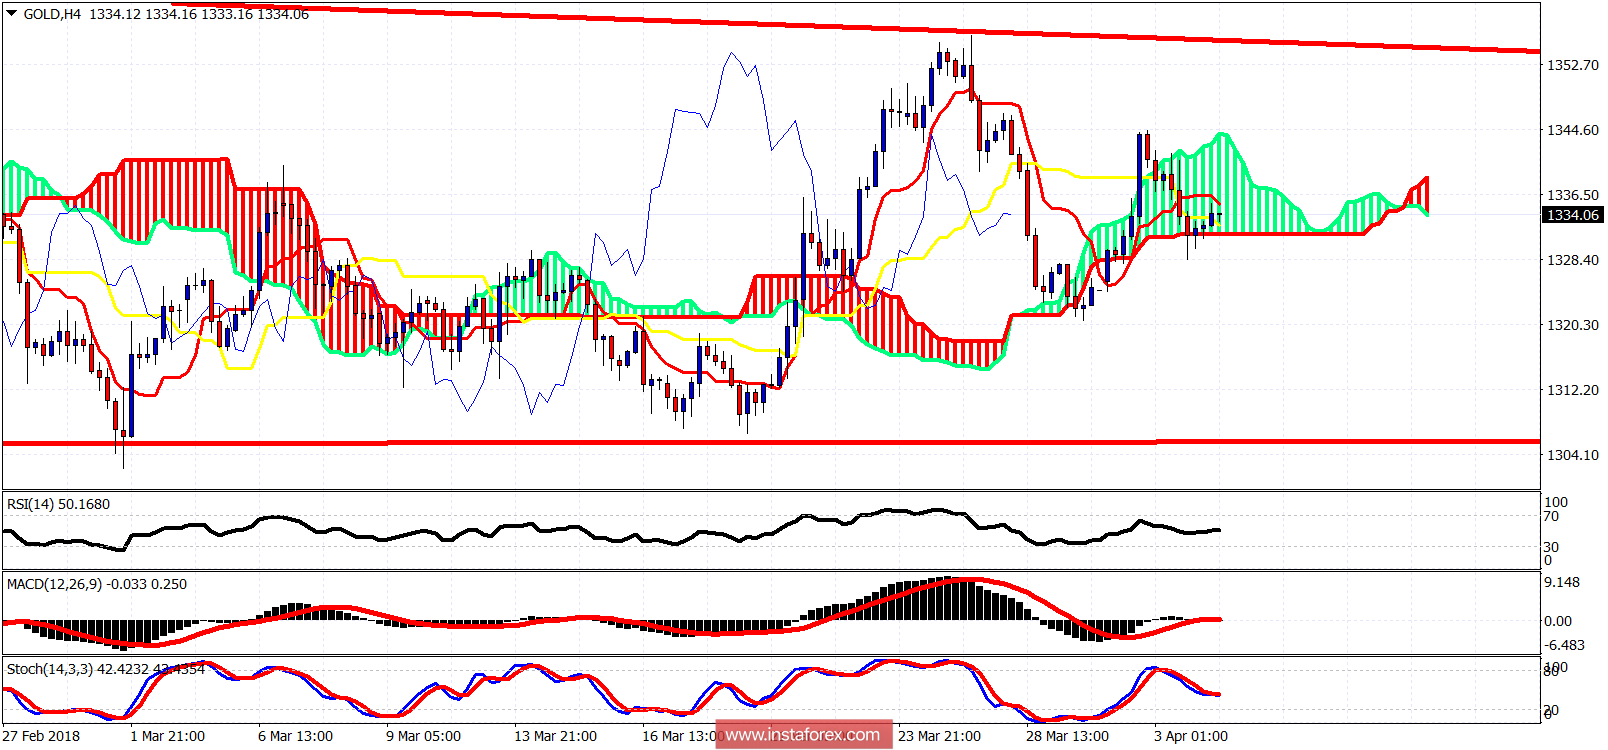
Red lines -trading range
The Gold price is still inside the long-term trading range. Short-term support is at $1,330. A break below it will most probably push price towards $1,320-$1,300. Resistance is at $1,342, a break above it will most probably push price towards $1,350-55 resistance.
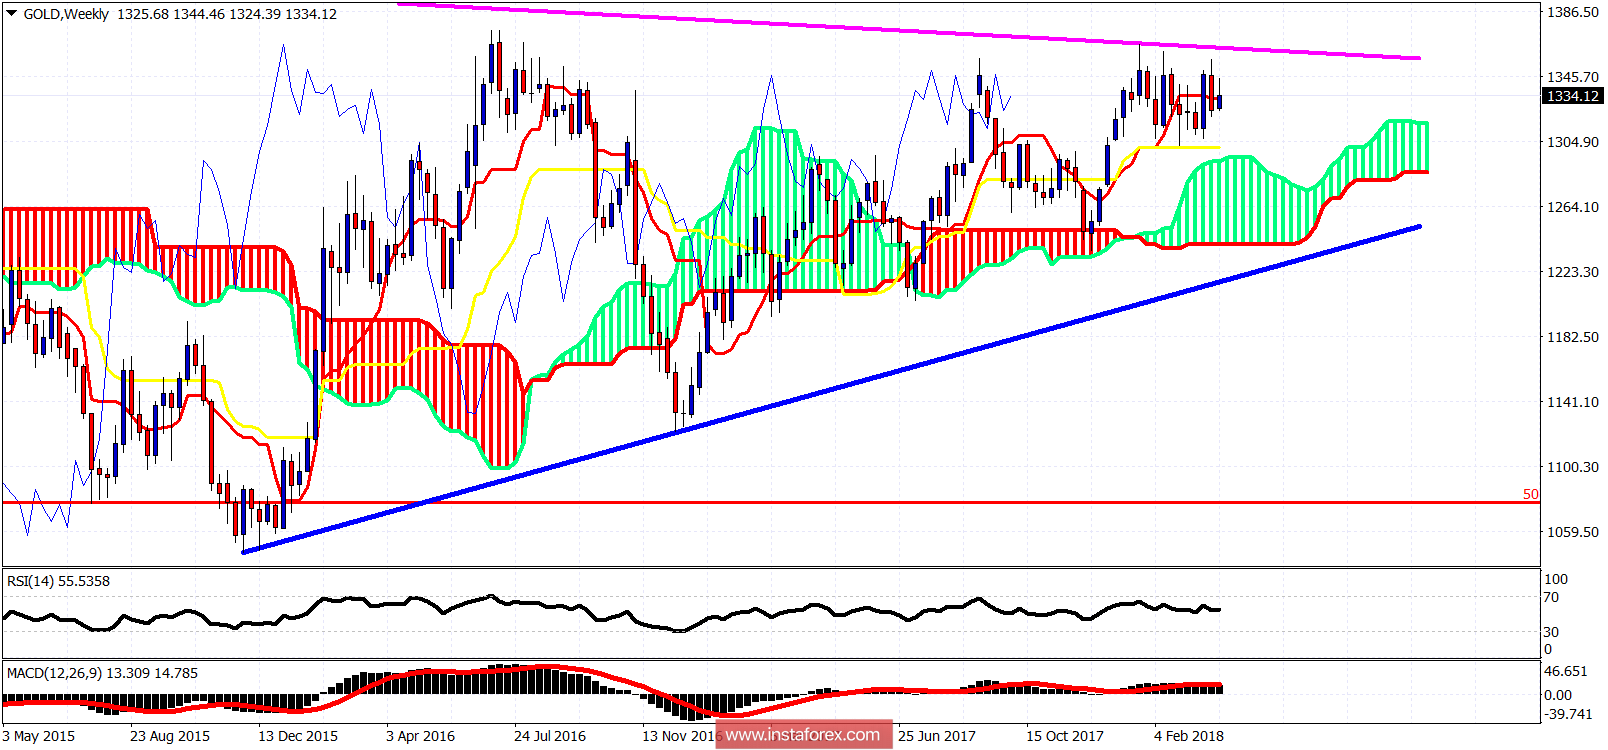
Magenta line - long-term resistance
Blue line - long-term resistance
The Gold price remains very close but still below the long-term resistance trend line. Price is consolidating near the highs after a sharp rally from the weekly cloud low in December. The high was made in January and since then we are consolidating. I believe that the most probable outcome will be another leg higher as long as we hold above the weekly cloud. Key levels of resistance are at $1,355-60.


