The bears appear to have lost the battle for the short-term, as the index stays above the 200 SMA at H1 chart. The near-term target to the upside lies at 90.63, at which a breakout should expose the 91.75 level and eventually it can strengthen the bullish bias. However, if the moving average gives up, then it can plummet towards 89.36.
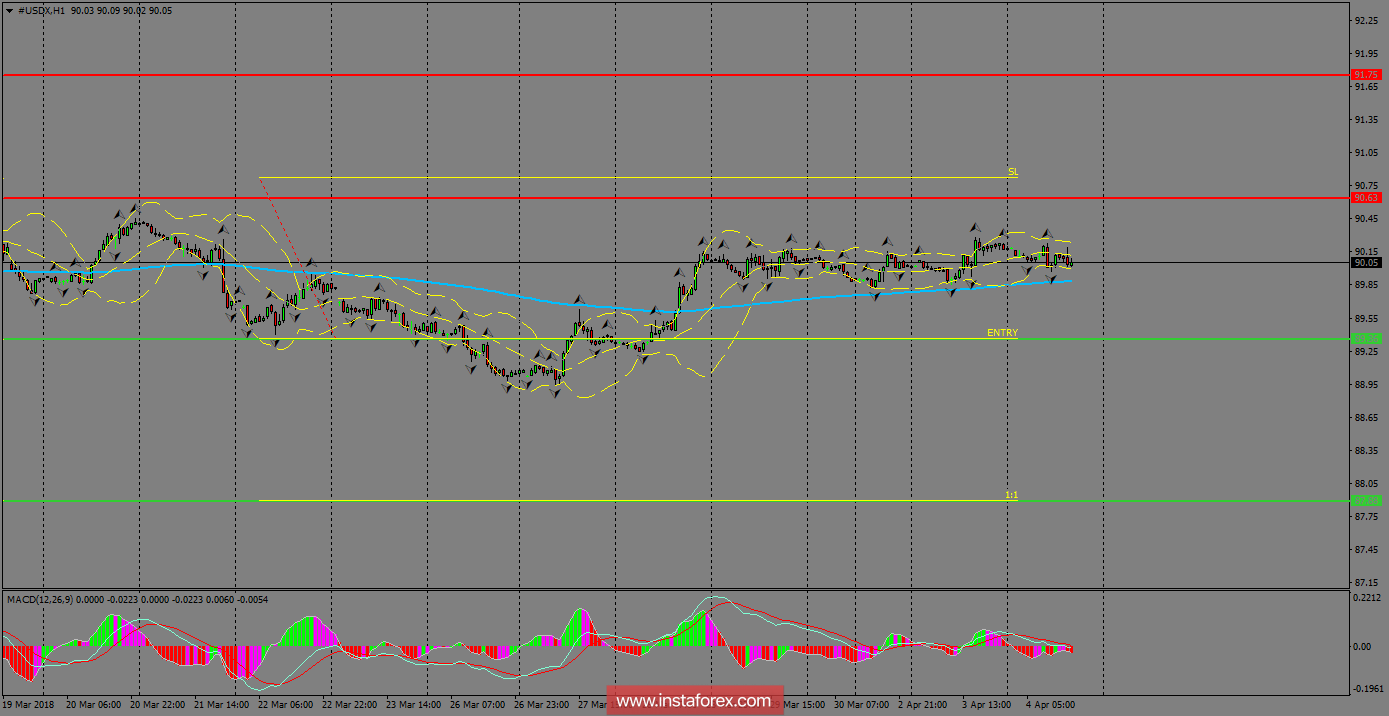
H1 chart's resistance levels: 90.63 / 91.75
H1 chart's support levels: 89.36 / 87.88
Trading recommendations for today: Based on the H1 chart, place sell (short) orders only if the USD Index breaks with a bearish candlestick; the support level is at 89.36, take profit is at 87.88 and stop loss is at 90.81.


