


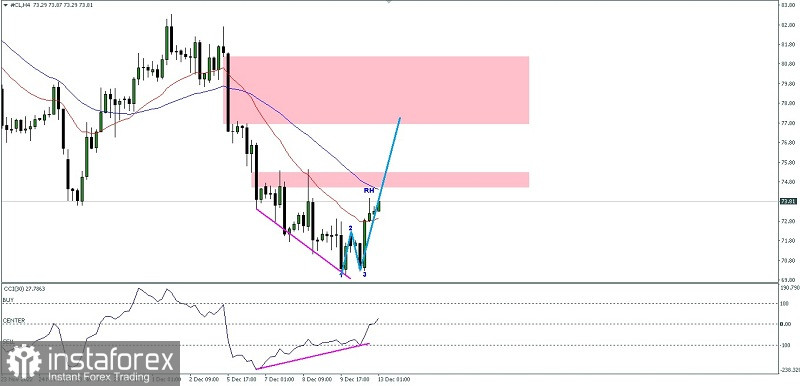
On the 4-hour chart of the Crude Oil commodity asset there are several interesting things:
1. There are deviations between price movements and the CCI indicator.
2. A Bullish Pattern 123 appears followed by the appearance of a Ross Hook.
3. The price is above the Moving Average EMA 21 (red).
Based on the three things above, we can conclude that Buyers are back in control of this commodity asset so that in the near future #CL is trying to break above the Ross Hook @ 73.97 level. tested and if the momentum and volatility are supportive then the 77.87 level will be the next target to aim for but all of this will cancel itself if on the way to the targets outlined earlier suddenly #CL returns to its initial bias (Bearish) if suddenly there was a decline beyond the level of 70.10.
(Disclaimer)


