


Technical outlook:
The US dollar index has been oscillating within a tight trading range between 104.20 and 104.80 for a few days. It looks like a contracting triangle before breaking out on either side. The index is seen to be trading close to 104.55 at this point in writing as prices continue within the trading range. A break above 104.80 or below 104.20 would project the next major move.
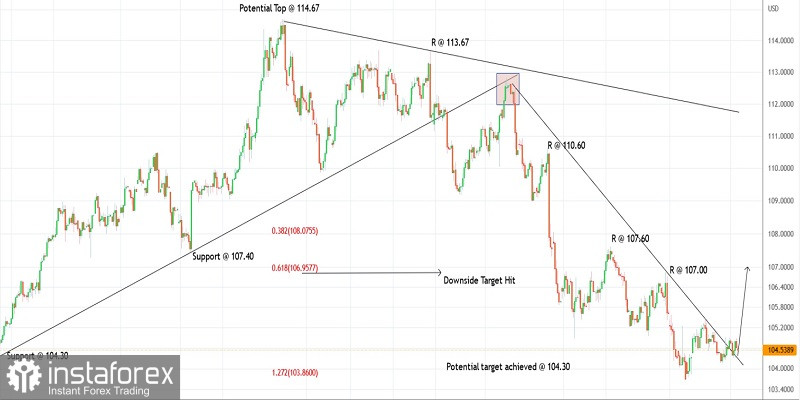
The US dollar index might have terminated its larger-degree corrective drop, which began from 114.70 highs earlier. If a bottom is in place at 103.70, the bulls will continue to remain in control from here and push prices above 114.70 in the next several weeks. Prices have also broken above the recent downtrend line as seen on the 4H chart, which validates the bullish move.
On the flip side, if the US dollar index is heading towards a much deeper correction below 103.70, prices need to produce a corrective rally at least towards the 110.00-50 area if not higher. Either way, a high probability remains for a bullish move from current levels, towards 110.50. The bears might come back into control thereafter. The outlook is bullish in the near to medium term.
Trading idea:
A potential bullish reversal against 103.70
Good luck!


