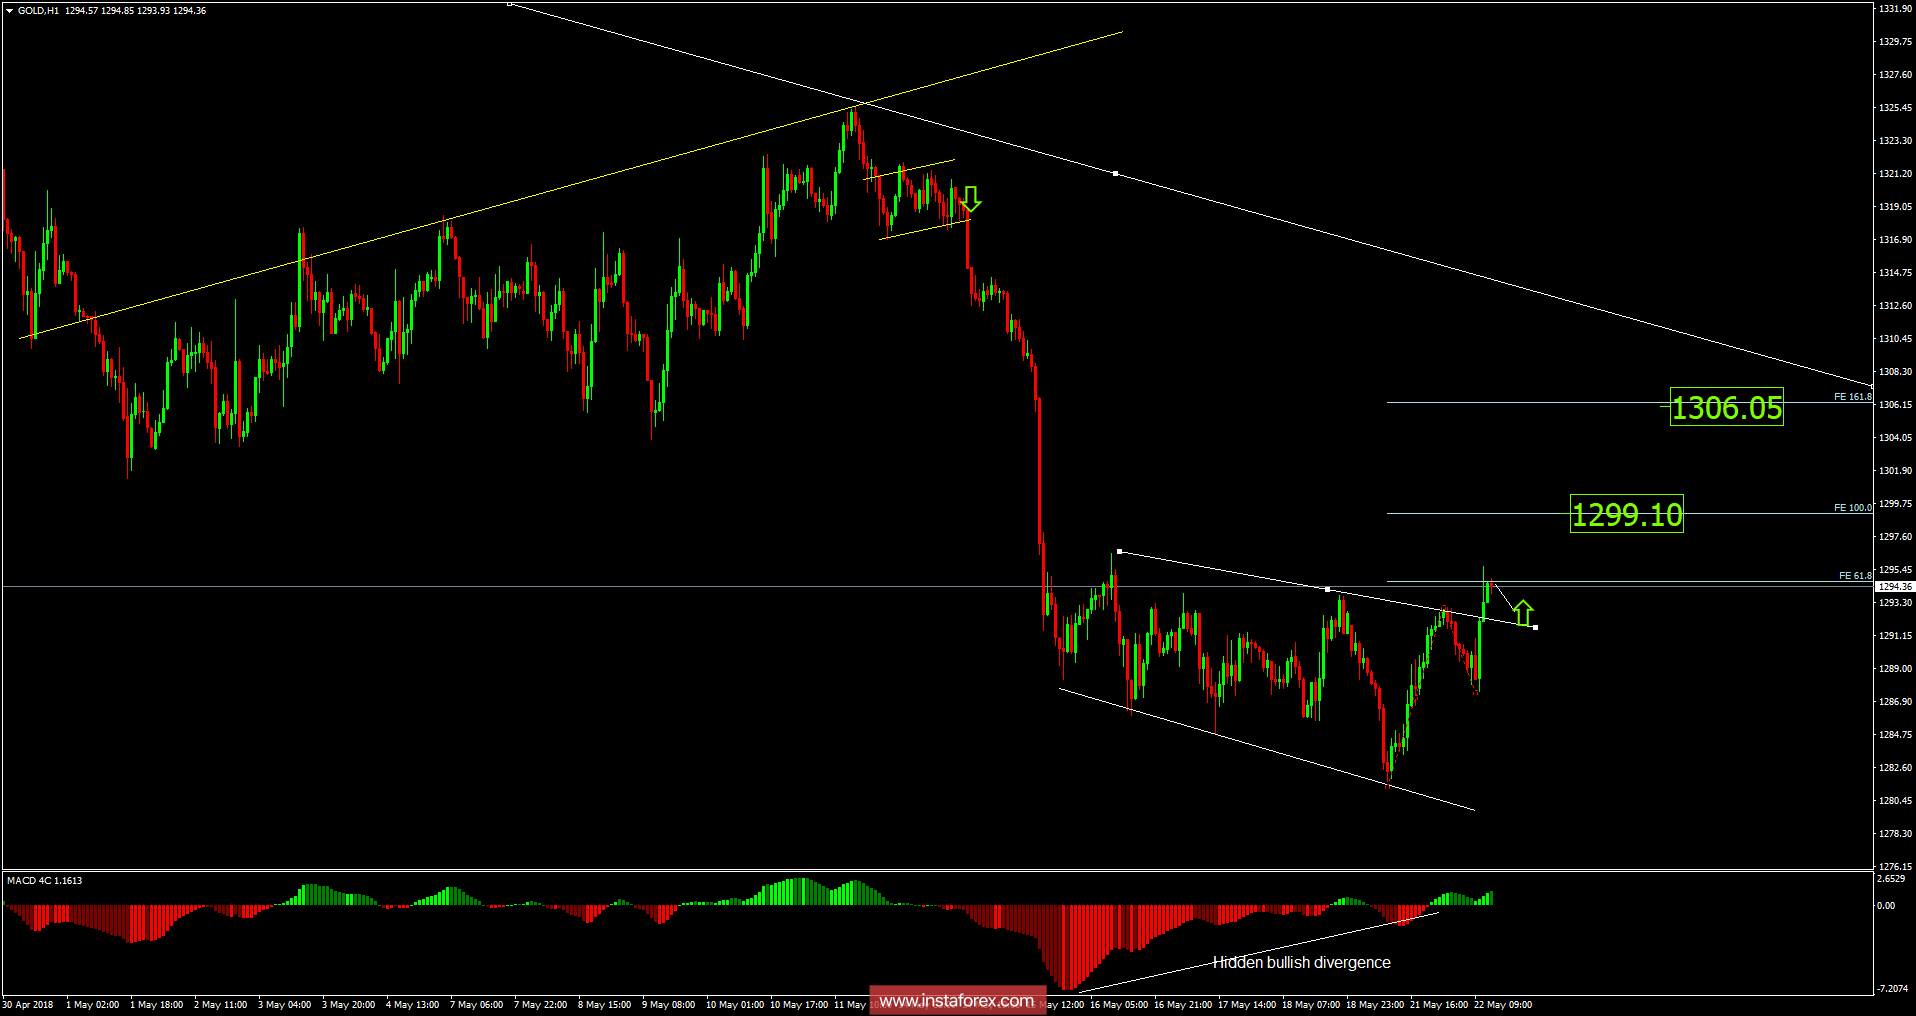
Recently, Gold has been trading upwards. The price tested the level of $1,295.00. According to the H1 time – frame, I found a valid breakout of downward channel (ending diagonal), which is a sign that selling looks risky. I also found a hidden bullish divergence on the MACD oscillator, which is another sign of strength. My advice is to watch for a potential bullish flag and then watch for buying. The upward targets are set at the price of $1,299.10 and at the price of $1,306.00.
Resistance levels:
R1: $1,296.15
R2: $1,300.40
R3: $1,307.85
Support levels:
S1: $1,284.45
S2: $1,277.00
S3: $1,272.00
Trading recommendations for today: watch for potential buying opportunities.


