Main
Quotes
Calendar
Forum
Русский
Bahasa Indonesia
Bahasa Malay
ไทย
Español
Deutsch
Български
Français
Tiếng Việt
中文
বাংলা
हिन्दी
Čeština
Українська
Română
Forex Calendar
Forex Quotes and Charts
News and Analytics
Forex Analysis
Forex News
Crypto News
News in Pictures
Forex Humor
Patterns
Trading Forex signals
Monitoring
Forex Trading Hours
Brokers Rating
Tools
Forex Calculator
Dividend Calculator
Volatility calculator
Currency converter
Timezone
UTC-12
UTC-11
UTC-10
UTC-9
UTC-8
UTC-7
UTC-6
UTC-5
UTC-4
UTC-3
UTC-2
UTC-1
UTC+0
UTC+1
UTC+2
UTC+3
UTC+4
UTC+5
UTC+6
UTC+7
UTC+8
UTC+9
UTC+10
UTC+11
UTC+12
JavaScript is disabled. For full functionality, please enable JavaScript.
FX.co ★ Daily Forex Analytics. Forecast of the currency exchange rate for today
Forex Analysis
Forex Analysis
:::
2018-06-25T06:57:09
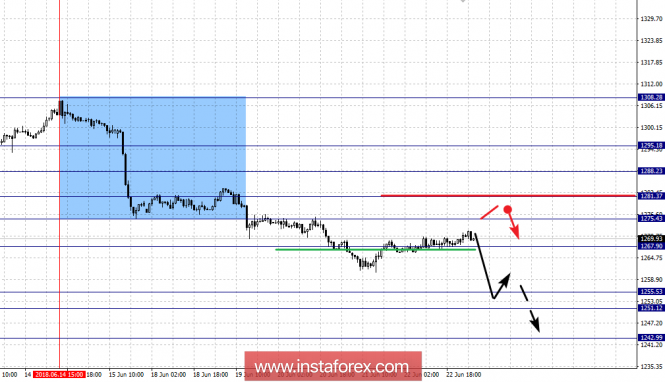
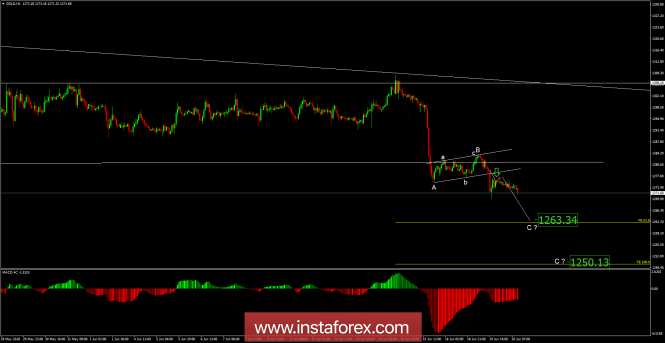
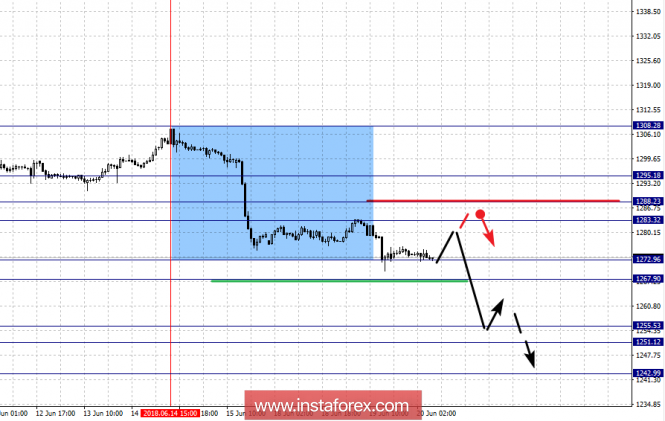
Fractal analysis of GOLD on June 25
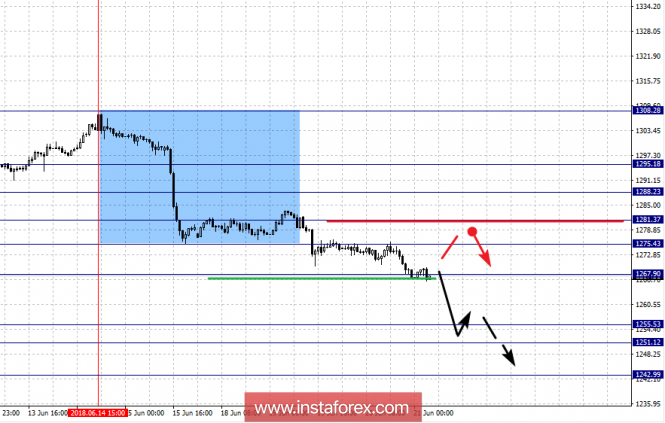
Analytical review of Gold. For Gold, we continue to follow the downward structure of June 14. Continued downward movement is expected after the breakdown of 1267.90, level 1275.43...
Show more
#Fractal analysis
#Gold
Forex Analysis
:::
2018-06-22T06:34:12
Technical analysis on Gold for June 22, 2018
With a low at $1,260.93 Gold price has made yesterday a possible reversal daily candle formation. A bullish bias has been formed and if price continues higher today, it will...
Show more
#Technical analysis
#Gold
Forex Analysis
:::
2018-06-21T09:10:50
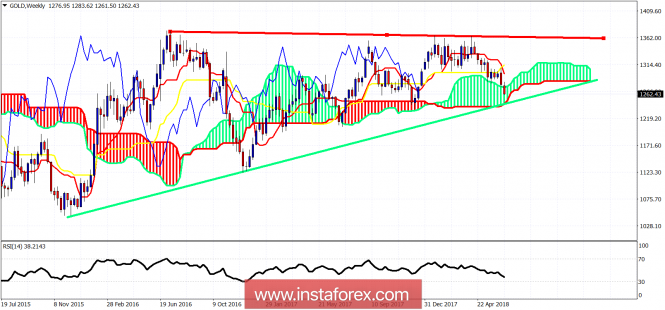
Day review of GOLD on June 21, 2018. Ichimoku Indicator
At the moment, the levels of 1285.57 - 1278.55 will form a strengthened line of resistance in case that rising players recovered their positions. The main reference points...
Show more
#Ichimoku Indicator
#Gold
Forex Analysis
:::
2018-06-21T08:35:54
Analysis of Gold for June 21, 2018
Recently, Gold has been trading downwards. As I expected, the price tested the level of $1,261.50 and met my first downward target. According to the H1 time - frame...
Show more
#Technical analysis
#Gold
Forex Analysis
:::
2018-06-21T07:01:51
Technical analysis on Gold for June 21, 2018
Gold price is making new lows. Trend remains bearish and there is no sign of a reversal. I believe Gold is oversold at the current levels and traders should...
Show more
#Technical analysis
#Gold
Get
$1500
STARTUP Bonus
Start trading without any investments
and risks
right now!
Get bonus
Forex Analysis
:::
2018-06-21T06:23:29
Fractal analysis for GOLD on June 21
Analytical review of Gold. For Gold, the downward structure of June 14 was defined as a local factor for the initial conditions. The level of 1295.18 is the key support...
Show more
#Fractal analysis
#Gold
Forex Analysis
:::
2018-06-21T03:19:44
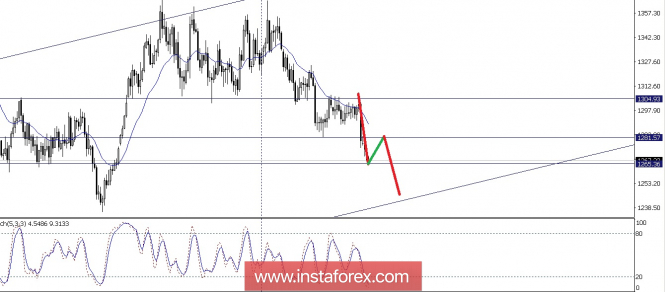
Technical analysis of Gold June 21, 2018
If We look at the Daily Charts from Gold, We can see clearly they moving in Weekly Up Slope Channel, and now they have a retracement to the down side...
Show more
#Technical analysis
#Gold
Forex Analysis
:::
2018-06-20T10:17:33
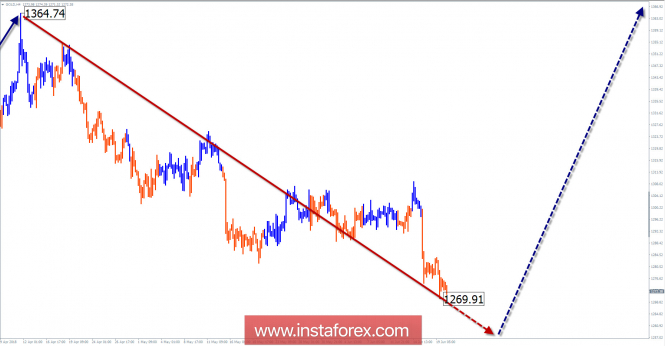
Review of GOLD for a week of June 20 on simplified wave analysis
The wave pattern of the H4 graph: The movement of the price of gold from January 25 sets a bearish wave. In the wave structure, a zigzag (A-B-C) is tracked...
Show more
#Wave analysis
#Gold
Forex Analysis
:::
2018-06-20T09:13:23
Analysis of Gold for June 20, 2018
Recently, Gold has been trading downwards. As I expected, the price tested the level of $1,269.00. According to the H1 time - frame, I found a broken bearish flag pattern...
Show more
#Technical analysis
#Gold
Forex Analysis
:::
2018-06-20T08:31:51
Fractal analysis of GOLD on June 20
Analytical review of Gold. According to Gold, the descending structure of June 14 was defined as local initial conditions. The level of 1295.18 is the key support for this structure...
Show more
#Fractal analysis
#Gold
You have watched all the best publications
presently.
We are already looking for something interesting for you...
Recently published:
More recent publications...