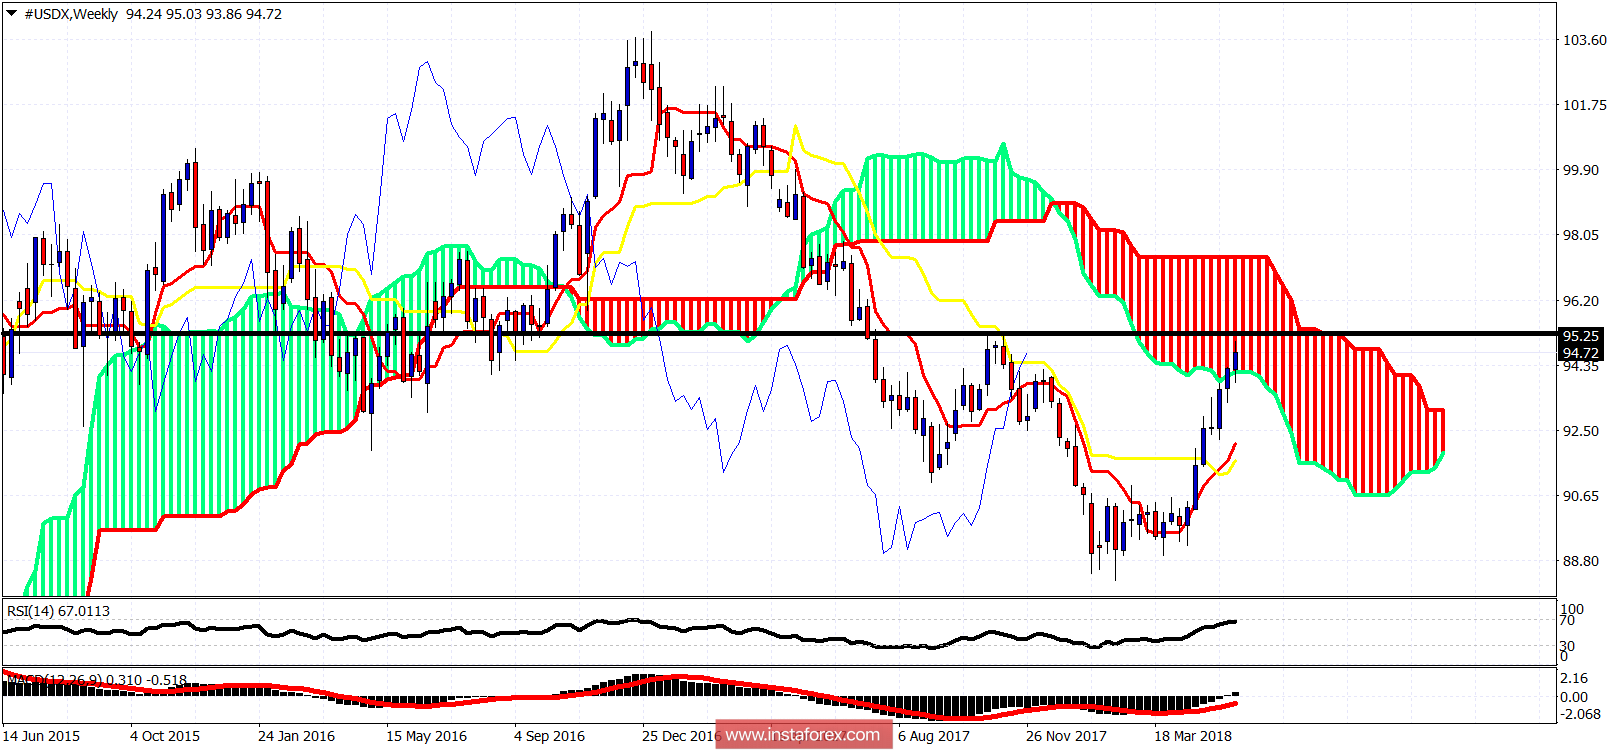
The Dollar index has reached the October 2017 highs and the weekly Kumo (cloud). This is a strong resistance area that justifies a pull back that is long overdue for the Dollar.

Black line - horizontal resistance
The Dollar index is in a short-term bullish trend. Price is above both the tankan- and kijun-sen indicators. The weekly candle has just entered inside the weekly Kumo. Now trading around 94.70, a weekly close below 94.15 will signal that a rejection has happened and a reversal is starting. If the weekly candle manages to hold above 94.20 we could see more upside although this is the least likely scenario for me. As long as price is above 92, I believe longer-term bulls will be safe. Bears need to break this level in order to regain full control of the trend again.


