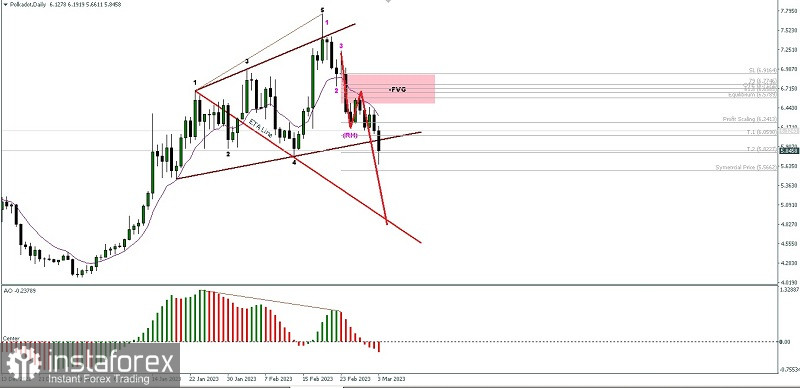
If we look on the daily chart of Polkadot cryptocurrency, there is a few interesting facts:
1. There is a Bearish Wolve Waves pattern.
2. The appearance of Bearish 123 pattern followed by the appearance of Ross Hook (RH).
3. There is a deviation betweet Awesome Oscillator indicator with price movement.
4. Moving price movement below EMA 10.
Based on the four facts above then We can conclude that Polkadot cryptocurrency is in Bearish condition and currently trying to test and breaks below the level of 5,5662. If this level successfully broken below then Polkadot will headed to ETA Line from Wolve Waves Pattern if the momentum and volatility support. As long as there is no sudden correction breaks above the level 7,0016 because if this level successfully broken above then it is very likely that the reduction scenario described above will be invalid and cancel by itself.
(Disclaimer)


