Crypto Analysis:::2025-10-03T06:50:26
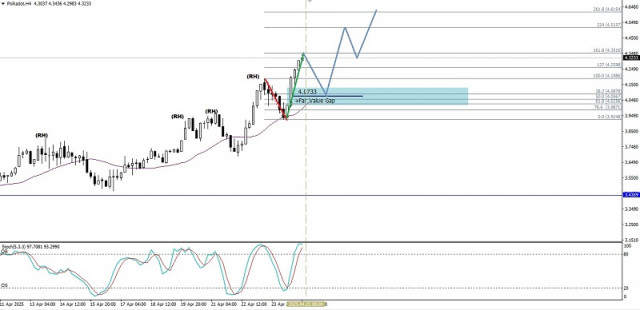
There is an opportunity and potential for Polkadot to strengthen toward its nearest resistance level today. Friday, October 03, 2025.
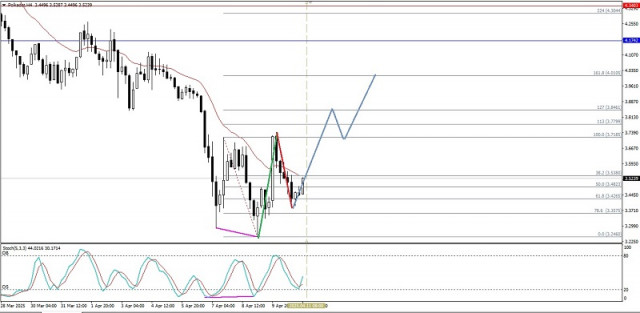
[Polkadot] – [Friday, October 03, 2025] Although the RSI is at the Neutral-Bearish level, but with EMA(50) positioned above EMA(200), Polkadot has the potential to strengthen today. Key Levels Level-Level...