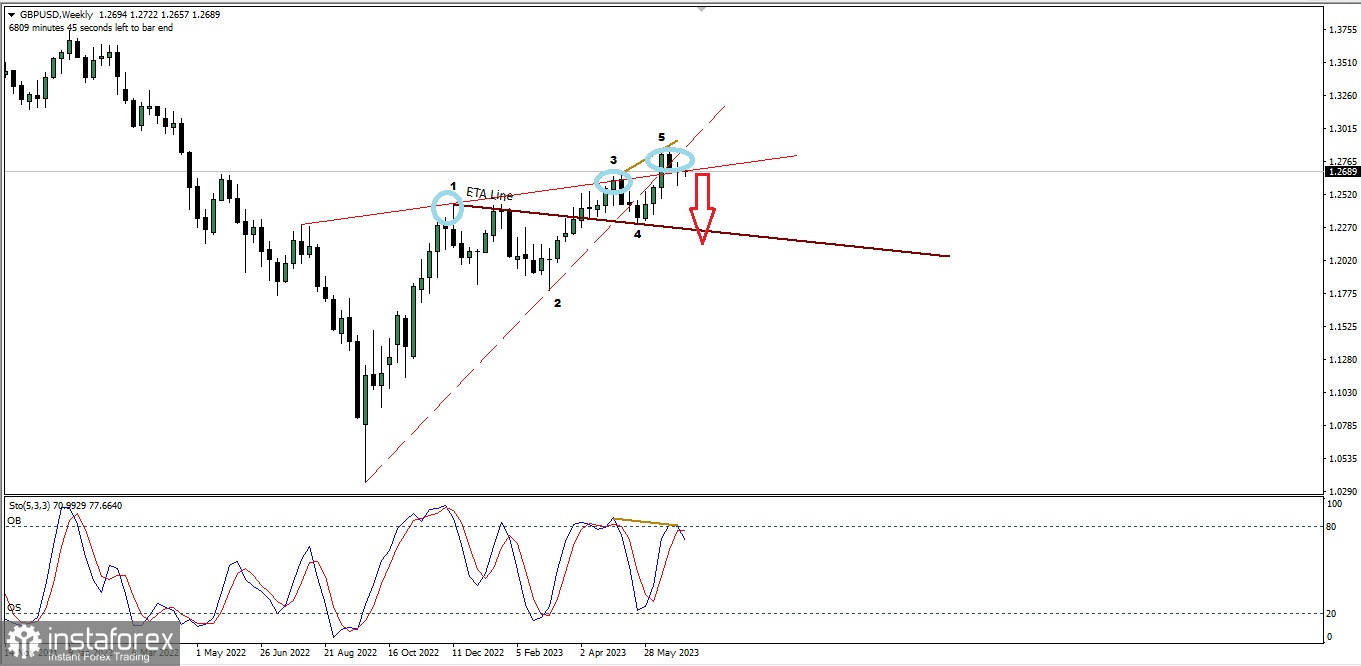
Based on what we can see on its GBP/USD weekly chart, there is a few interesting things:
1. The appearance of Bearish Divergent between Stochastic with GBP/USD.
2. The appearance of Bearish Three Little Indian (Cyan circle).
3. The appearance of Rising Wedge weakening Pattern.
4. There is a Wolve Waves Pattern.
Based on those facts above, Cable seems has the chance to continue its quite huge downward tren, maximum in the next 2 weeks where as long as there is no upward correction rally that exceeds the 1.2850 level, GBP/USD will try to fall down towards the trend line ETA Line of its Wolve Wave or at least to the 1.2307 level as its main target.
(Disclaimer)


