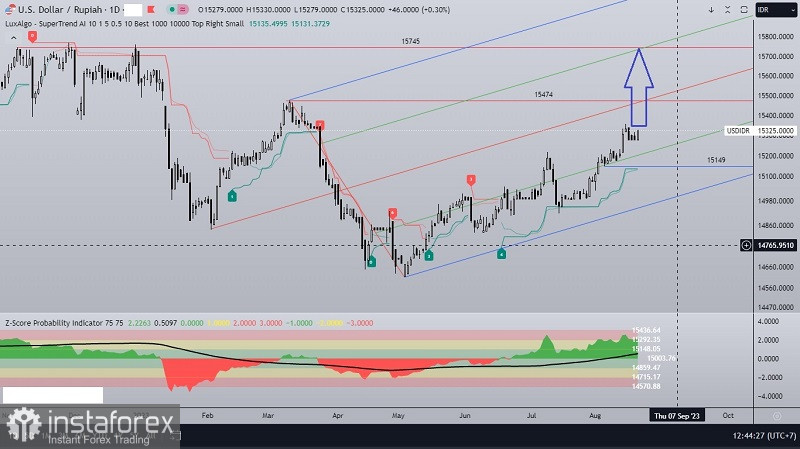
Based on what appears on the daily chart for the USD/IDR exotic currency pair, it seems that the Rupiah will experience a weakening against the United States Dollar, this is clearly seen by:
1. Price movements move harmoniously within the Bullish Pitchfork channel.
2. USD/IDR is currently above the BUY signal from the AI Supertrend indicator.
3. The Z-Score indicator is above the Moving Average signal (Black).
So based on the above data, USD/IDR in the next few days has the potential to test the 15358 level. If this level is successfully broken above, it is highly probable that USD/IDR will continue strengthening up to the 15474 level as its main target and if the momentum and volatility are sufficiently supportive, then the 15745 level. will be the next target to be tested but considering that Wednesday 23 August 2023 tomorrow the Mercury Retrograde phenomenon begins, there is a possibility that the Garuda currency has the potential for a Turning Point from its weakening so far, but as long as the USD/IDR weakening does not penetrate below the 15149 level, USD/IDR is still opportunity to continue strengthening.
(Disclaimer)


