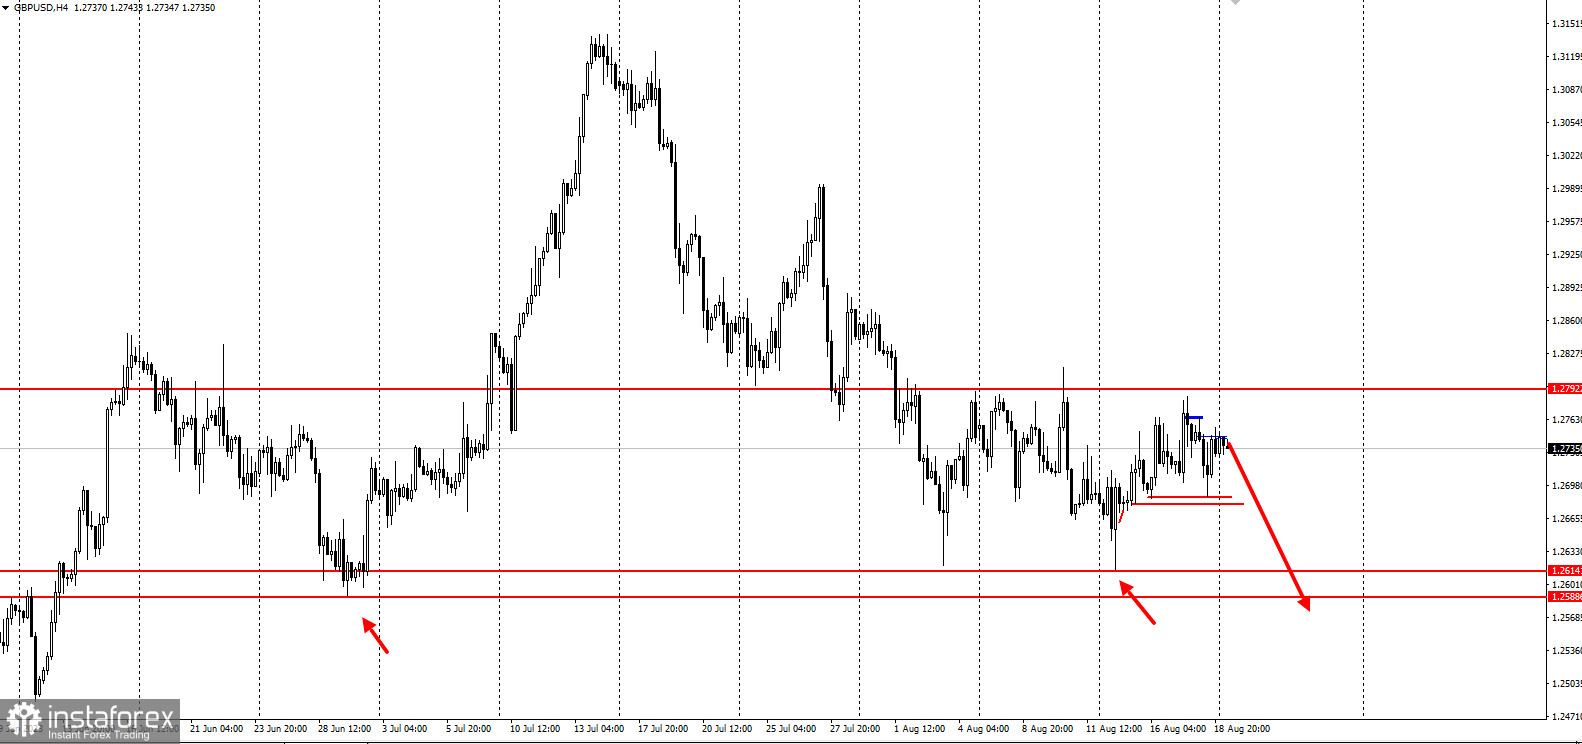
GBP/USD showed a very weak bullish correction last week, all within the overall downward trend. It could update the monthly lows, following this trajectory:

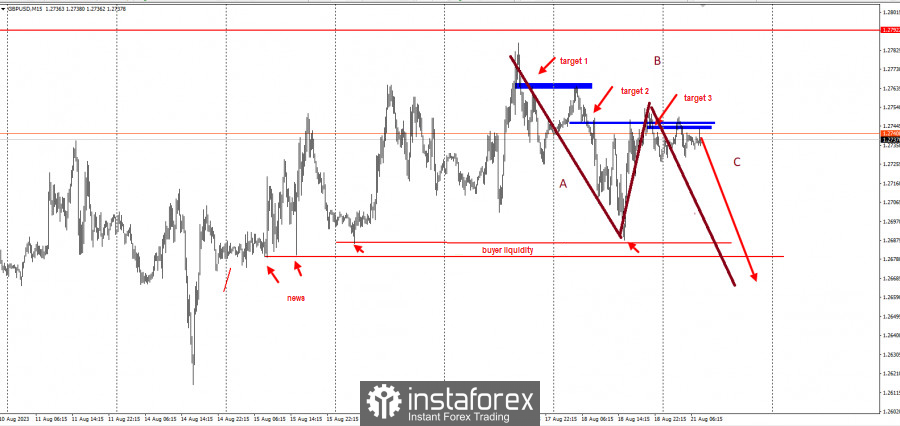
The third wave of the decline began to form in the M15 timeframe, with the short breaks (blue lines) being held by sellers. This could be a signal for a price decrease in the pair.

Considering the three-wave pattern (ABC), where wave A represents the downward movement last week, market players could sell the pair with stop-loss at 1.27550 and take-profit at the breakdown of 1.26860, 1.26786, and 1.25900.
The trading idea came from the framework of the "Price Action" and "Stop Hunting" strategies.
Good luck in trading and don't forget to control the risks! Have a nice day.


