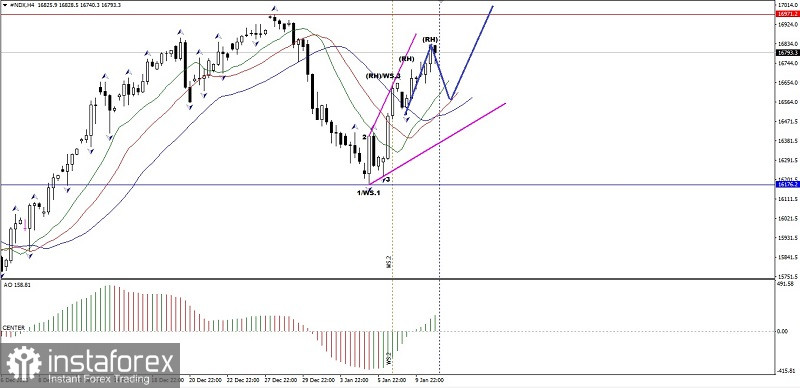
Since the forming of Bullish Divergent Bar (WS.1) on the 4 hour chart of Nasdaq 100 Index, so that the strengthening begins on those index, also with the appearance of WS.2 (SAO) and WS.3 (Fractal), then it is confirmed that in the near future #NDX will try to reach the nearest Ross Hook which coincidentally also the nearest Fractal (WS.3) which is the level 16971.2. But please pay attention to the potential of downward correction because with the appearance of the Ascending Broadening Wedge signaling that there is the exhaust from the strengthening that is happening but, as long as the downward correction does not break below the level 16294.4, then the strengthening scenario that has been described before still valid.
(Disclaimer)


