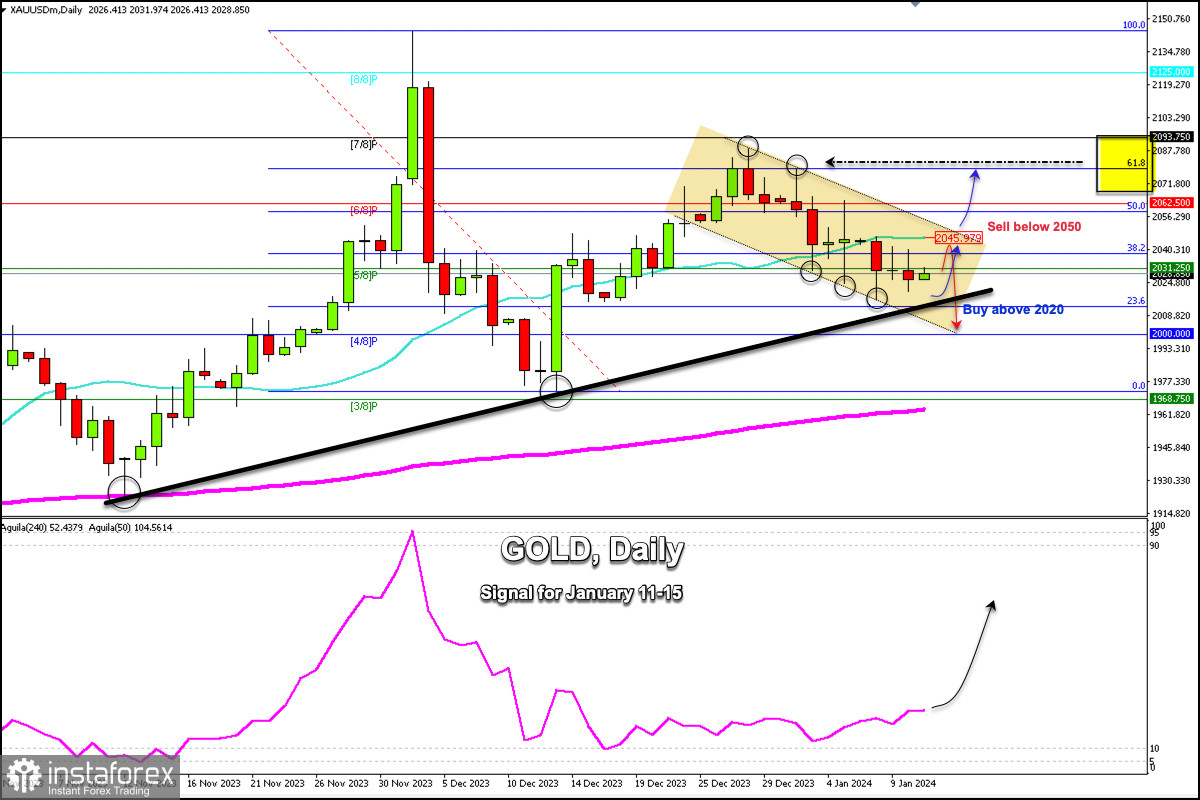
Early in the European session, Gold is trading around 2,028.85, below the 21 SMA, and around 5/8 Murray. In the daily chart, we can see that gold has been trading within a bearish trend channel since December 28 and is now likely to extend a bearish movement that could occur if 2,020 is broken.
Furthermore, gold could be consolidating in the coming days between a range below 2,050 and above 2,020. Both levels represent the top of the downtrend channel and the bottom of the uptrend channel formed since November 12.
If the United States inflation data that will be published in the American session comes out above 3.2%, it could cause a sharp drop in gold and the metal could reach the psychological level of $2,000.
On the other hand, in case gold breaks and consolidates above 2,050, we could expect an acceleration of the bullish movement. If this event occurs, the XAU could reach 6/8 Murray (2,062), which represents a strong resistance zone, and could finally reach the 61.8% Fibonacci retracement at 2,079.
Since gold reached its high around 2,144 and its low around 1,973 between December 3 and December 13, it retraced towards 61.8% Fibonacci and from there we observe a further bearish movement which has been underway since December 28.
Now, gold could sharply break out of this bearish trend channel or break out of the bullish channel. A new bearish cycle could be in the cards if gold falls below the psychological level of $2,000. In this case, the instrument could even reach the 200 EMA located at 1,960.


