


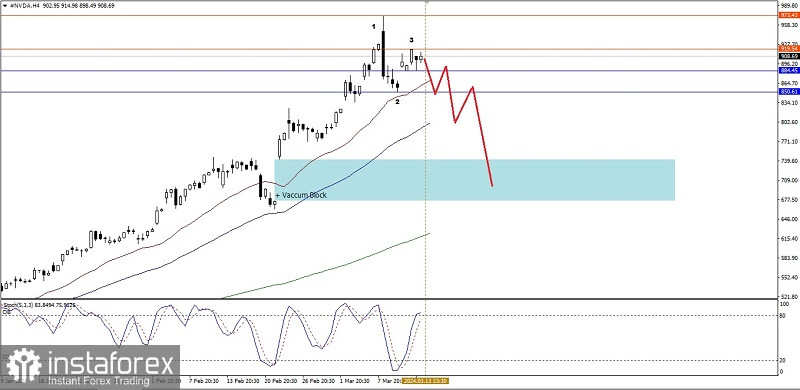
Even though on the 4-hour chart Nvidia's CFD shares are still dominated by Buyers, this is reflected by the Golden Cross of EMA 20 above EMA 50, but there is the potential for #NVDA to be corrected to weaken to close the Vacuum Block (Gap) below the current price movement where #NVDA is currently trying to breaks below the 884.45 level. If this level is successfully broken below, in the near future #NVDA will continue its weakening up to the 850.61 level as the main target and if the momentum and volatility are sufficiently supportive then the area level 742.44-675.86 will be the next target but the correction scenario is weakening This could cancel itself if on its way to these targets suddenly #NVDA returns to its initial bias and breaks above the 919.54 level.
(Disclaimer)


