


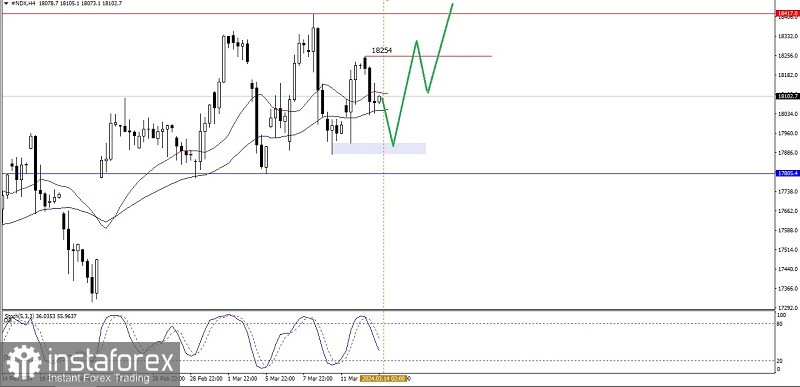
If we look at the 4-hour chart of the Nasdaq 100 index, we can see that the 20 EMA is still above the 50 EMA (Golden Cross), which indicates that Buyers still dominate this index, but with the Stochastic Oscillator's condition crossing downwards, in the near future #NDX has the potential to be corrected down to a lower level. to the support area level (+Rejection Block) 17971.1-17879.9. If this area level is strong enough to withstand the rate of weakening correction then #NDX has the potential to return to its initial bias up to level 18254.0 as the main target and level 18417.0 as the next target, but if the Support area level ( +Rejection Block) is not strong enough to withstand the rate of correction, especially if it breaks below 17805.4 then the strengthening scenario as previously described will be on hold for a while.
(Disclaimer)


