


Analysis of GBP/USD 5M
GBP/USD traded with low volatility, and managed to rise. Needless to say, the pound did not have any significant reason to rise on Wednesday. It edged up, but what's important is that we did not see a more predictable decline. The UK released two reports. GDP grew by 0.2% in January, which coincided with forecasted values, so this did not boost the pound. Production output in the United Kingdom decreased by 0.2% in January, which the market did not expect, but the pound did not fall either. Therefore, as always, we believe that the GBP/USD pair continues to rise without any logical reason behind it.
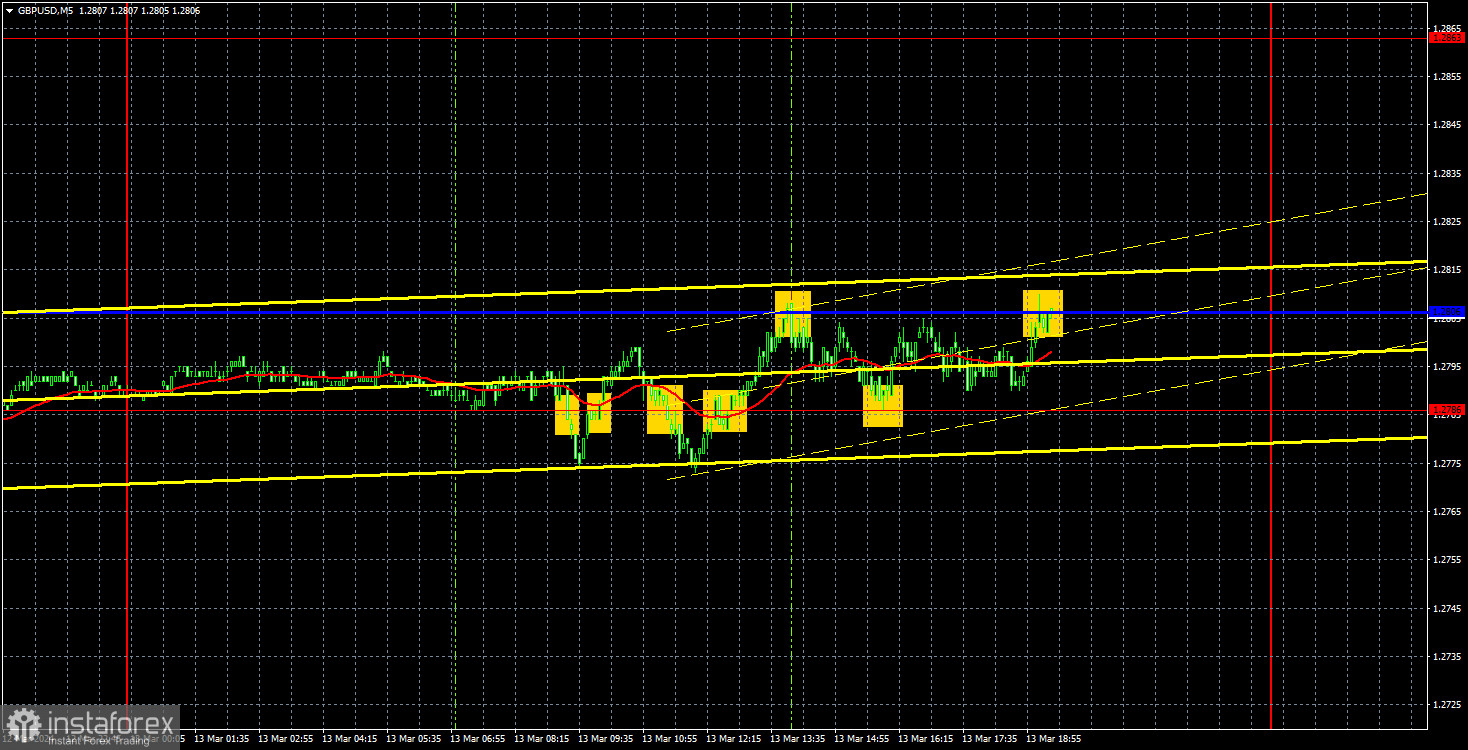
From a technical perspective, the price did not even reach the Senkou Span B line, which is clearly seen on the 5-minute timeframe. Yesterday, it returned to the critical line twice, but with low volatility, the lines of the Ichimoku indicator are not strong. So what's the point if the pair is either in a flat state for three months or rises for no reason? The price did not consolidate above the Kijun-sen line, so theoretically, the pair could fall. But for what? 20-30 pips, which will not affect anything?
Several trading signals were formed yesterday, all within a range of 20 pips. Signals between the level of 1.2786 and the Kijun-sen line were not worth considering. Also, the price formed false sell signals around the level of 1.2786 twice. Considering the strength and illogical nature of the bullish trend, traders should have been cautious with these signals. Now is not the best time to trade the GBP/USD pair.
COT report:
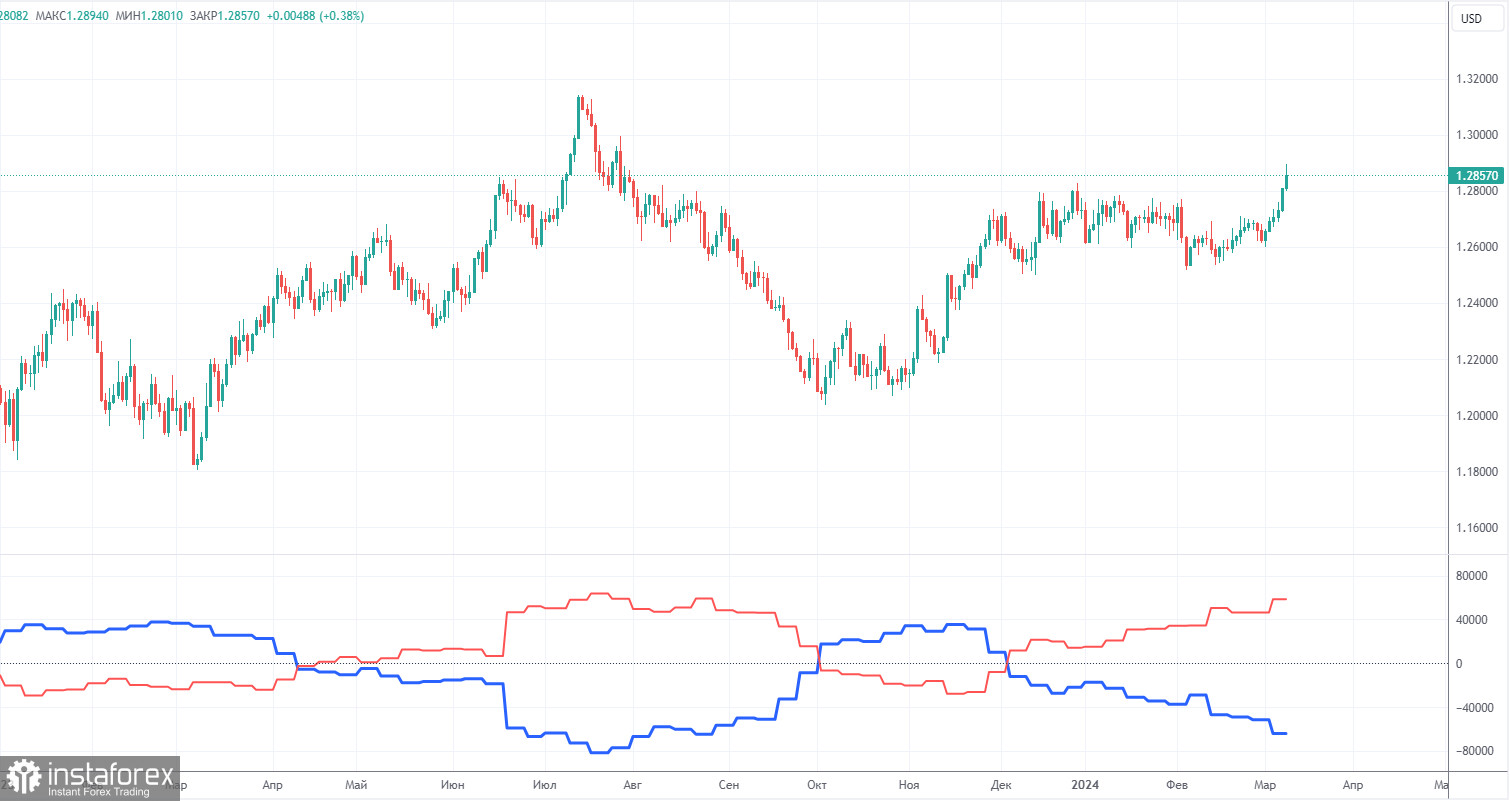
COT reports on the British pound show that the sentiment of commercial traders has frequently changed in recent months. The red and blue lines, which represent the net positions of commercial and non-commercial traders, constantly intersect and, in most cases, remain close to the zero mark. According to the latest report on the British pound, the non-commercial group opened 10,300 buy contracts and closed 1,700 short ones. As a result, the net position of non-commercial traders increased by 12,000 contracts in a week. Despite the fact that the net position of speculators is growing, the fundamental background still does not provide a basis for long-term purchases of the pound sterling.
The non-commercial group currently has a total of 102,000 buy contracts and 43,900 sell contracts. The bulls have a big advantage. However, in recent months, we have repeatedly encountered the same situation: the net position either increases or decreases, the bulls or the bears either have the advantage. Since the COT reports do not provide an accurate forecast of the market's behavior at the moment, we have to scrutinize the technical picture and economic reports. The technical analysis suggests that there's a possibility that the pound could show a pronounced downward movement, but there is currently no sell signal on any timeframe.
Analysis of GBP/USD 1H
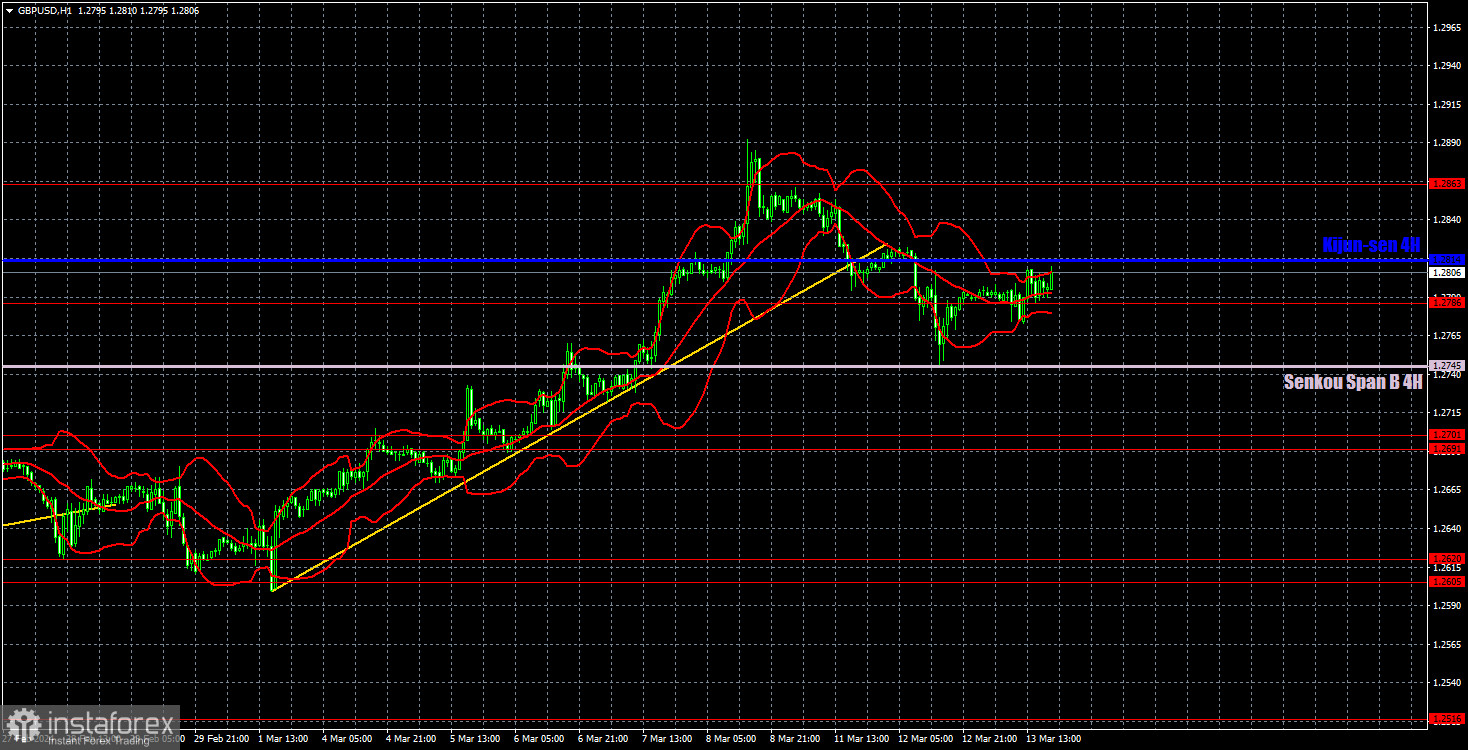
On the 1H chart, GBP/USD resumed the uptrend after a three-month flat. The economic reports and the fundamental background do not support the British pound, but we have already seen something similar in the second half of 2023. Back then, the British pound also grew for no apparent reasons. If the price consolidates below the trendline and the Kijun-sen line, we can hope that the dollar may start a small corrective phase, but so far, we haven't seen any pronounced decline from the pair. The pound is overbought but it continues to rise.
As of March 14, we highlight the following important levels: 1.2215, 1.2269, 1.2349, 1.2429-1.2445, 1.2516, 1.2605-1.2620, 1.2691, 1.2786, 1.2863, 1.2981-1.2987. The Senkou Span B line (1.2745) and the Kijun-sen line (1.2814) can also serve as sources of signals. Don't forget to set a Stop Loss to breakeven if the price has moved in the intended direction by 20 pips. The Ichimoku indicator lines may move during the day, so this should be taken into account when determining trading signals.
On Thursday, there are no important fundamental and macroeconomic events lined up for the UK. The US docket will feature three reports of moderate significance, which are unlikely to boost the dollar even if they show good values. We expect volatility to remain weak.
Description of the chart:
Support and resistance levels are thick red lines near which the trend may end. They do not provide trading signals;
The Kijun-sen and Senkou Span B lines are the lines of the Ichimoku indicator, plotted to the 1H timeframe from the 4H one. They provide trading signals;
Extreme levels are thin red lines from which the price bounced earlier. They provide trading signals;
Yellow lines are trend lines, trend channels, and any other technical patterns;
Indicator 1 on the COT charts is the net position size for each category of traders;
Indicator 2 on the COT charts is the net position size for the Non-commercial group.


