Overview:
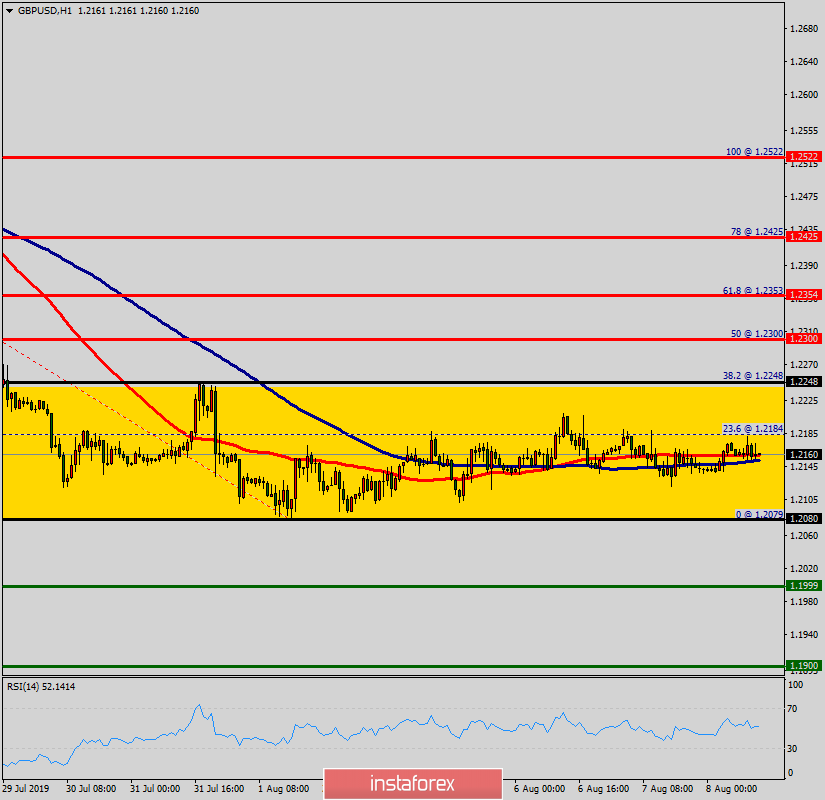
- Pair: GBP/USD
- Time frame: H1
- Pivot point: 1.2248
- Trend: Sideways trend (ranging)
The trend of GBP/USD pair movement was controversial as it took place in a narrow sideways channel, the market showed signs of instability.
Amid the previous events, the price is still moving between the levels of 1.2248 and 1.2080.
So, the daily resistance and support are seen at the levels of 1.2248 and 1.2080 respectively.
Therefore, it is recommended to be cautious while placing orders in this area. So, we need to wait until the sideways channel has completed.
On the H1 chart, the market seemed sideways for that the trend had hit only the resistance 1 last week and the range was tiny around 168 pips (1.2248 - 1.2080).
Moreover, it should be noted that if moving averages cross over one another, then we expect sideways trend. But if moving averages cross over one another, the trend is probably changing soon.
Finaly, if the pair fails to pass through the level of 1.2248, the market will indicate a bearish opportunity below the strong resistance level of 1.2248. Sell deals are recommended below the level of 1.2248 with the first target at 0.6600. If the trend breaks the support level of 1.2080 in rder to test the double bottom.
The market is still ranging, hence we still prefer thesideways trend scenario. Consequently, it is of the wisdom to trade only between these levels of 1.2248 and 1.2080 this week.