


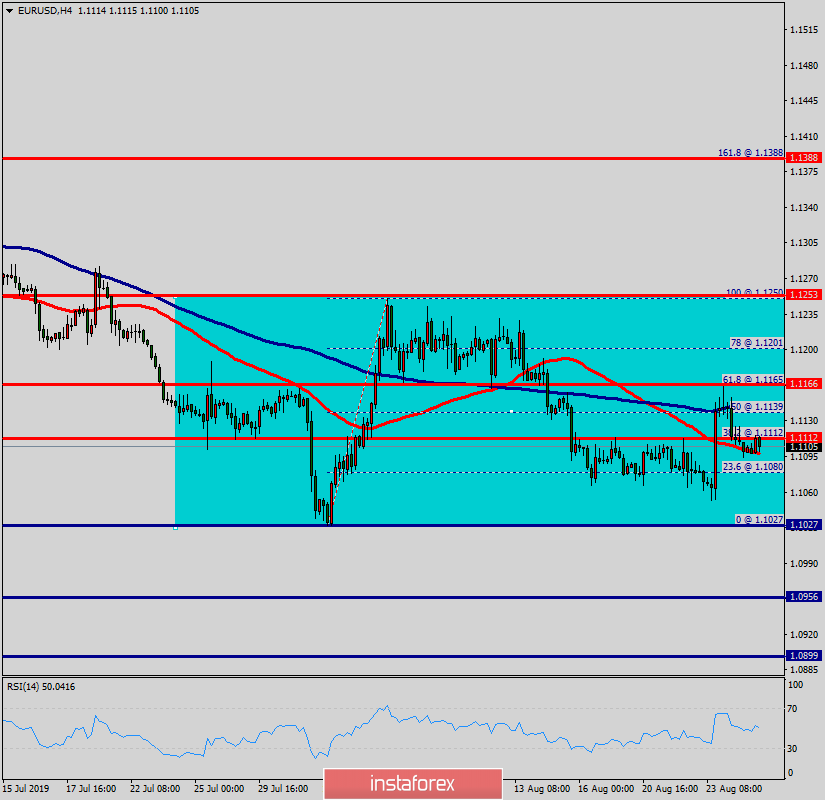
The EUR/USD pair faced resistance at the level of 1.1166 (61% of Fibonacci retracement levels) in the H4 chart.
Minor resistance is seen at 1.1112. The EUR/USD pair is still moving around the key level at 1.1112 , which represents a daily pivot in the H4 time frame at the moment. The RSI indicator is still calling for a strong bearish market as well as the current price is also below the moving average 100 and 50.
The EUR/USD pair traded below a broken trend line and swing zone at 1.1112-1.1166. The current rise will remain within a framework of correction. However, if the pair fails to pass through the level of 1.1166, the market will indicate a bearish opportunity below the strong resistance level of 1.1166.
Since there is nothing new in this market, it is not bearish yet. Sell deals are recommended below the level of 1.1166 with the first target at 1.1027. If the trend breaks the support level of 1.1027, the pair is likely to move downwards continuing the development of a bearish trend to the level 1.0956 in order to test the daily support 2. Stop loss should always be taken into account, accordingly, it will be of beneficial to set the stop loss above the last top at 1.1250.


