


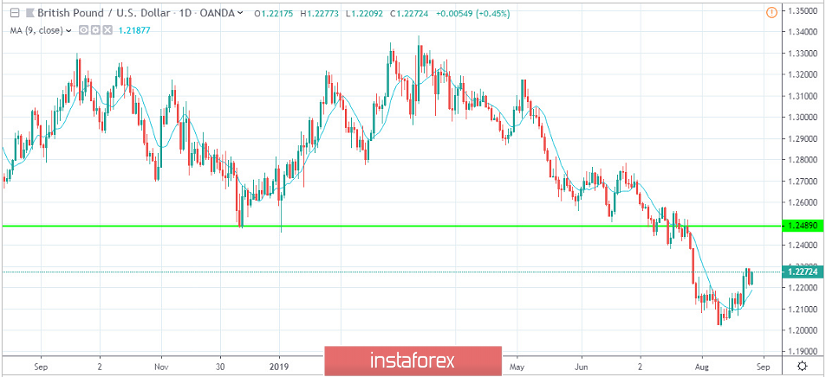
The above picture is the daily chart of GBP/USD. We have represented the resistance area with a green line, and the blue line shows the moving average running through the chart. What we are watching is that the price is trading firmly above the moving average line. You should note that the pair is in a strong downtrend for a few months in a row. Bearing in mind related risks, you should be selling as well. Currently, the price is pulling back, and we see a good bounce back. What we need is to find out is whether the price will sustain or not. There are no signs at the moment for selling. However, it would be a good idea to consider short positions on GBP/USD. If the price continues to trade above the blue moving average line, then you can plan buying GBP/USD. In this case, your target has to be the green resistance line keeping a stop loss below the low near 1.2000. Remember, as you are going against the trend, your stop has to be tight. People with larger risk appetite can buy at the current market price (CMP). If you wish to be on the safer side, we suggest you wait for the price to pull back near 1.24890 area and then look for selling from there. You could keep a stop loss just above 1.26000.


