


 nz
nz
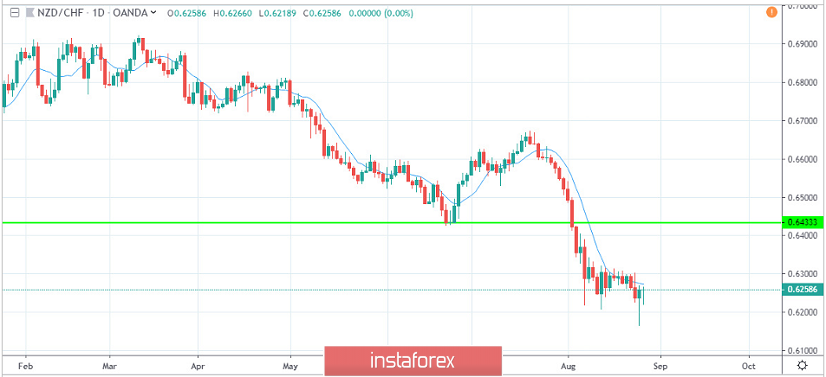
The above picture is the daily chart of NZD/CHF. This currency pair has been in a downtrend from the start of the year. Now the price has stalled near the 0.62000 area. The price is acting as support for NZD/CHF. The green line shows the resistance area from where we can expect some price reaction. The moving average is indicated by a blue line. The price is continuously trading below the blue line, and this proves the dominance of sellers. From a trading point of view, the pair does suggest gainful trading opportunities. However, if you still wish to trade this currency pair, you should wait until the price crosses the blue moving average line and then you can comfortably take a buy. Again, this would be a very aggressive entry. So, your stop loss has to be tight near 0.62000. We recommend you to trade following the trend. This is possible if the price retraces back to our green line and trades below the moving average line. If this happens, you have a good excuse to take the sell with minimum risk. But if we don't get that retracement, do not chase the market by selling at the current market price (CMP). Your stop loss will be above 0.66000 and target will be at the recent low. This could result in 1:3 risk to reward ratio, which is not bad at all.


