


The GBP/USD pair continues to move downwards from the level of 1.2329.
Last week, the pair dropped from the level of 1.2329 to the bottom around 1.2270. But the pair has rebounded from the bottom of 1.2270 to close at 1.2306.
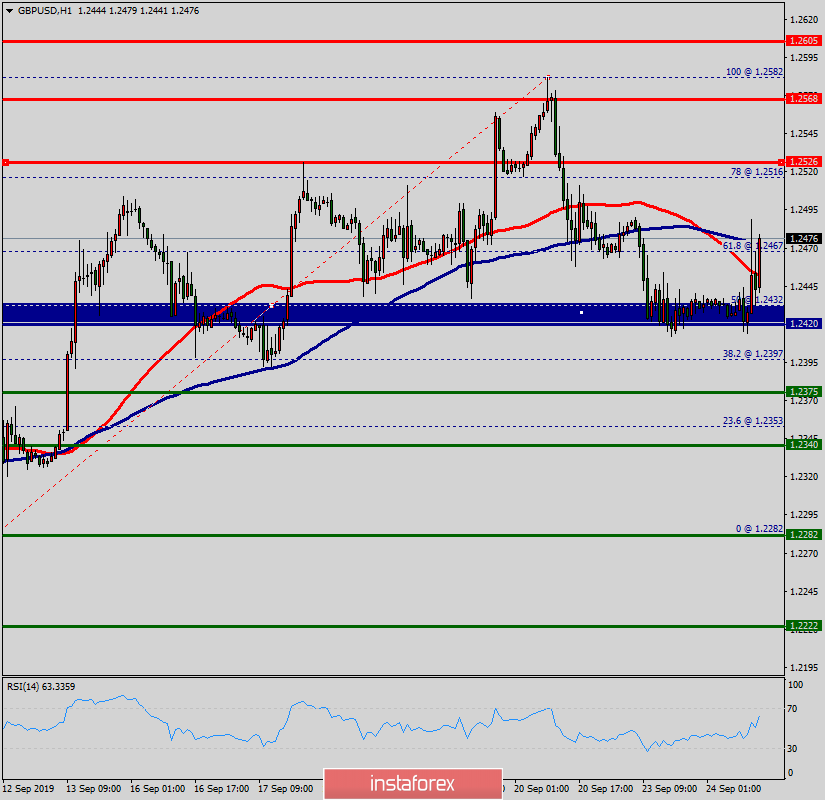
Today, the first support level is seen at 1.2270, the price is moving in a bullish channel now.
There is a possibility that the GBP/USD pair will move upside and the structure of a raise does not look corrective. The trend is still above the 100 EMA for that the bullish outlook remains the same as long as the 100 EMA is headed to the downside.
The RSI (Relative Strength Index) is becoming to signal an upward trend. The RSI readings around 30 indicate that the pair is oversold. So, the areas that are potentially oversold at the 1.2270 price.
It is possible that the pair will move upwards continuing the development of the bullish trend to the level 1.2329 in order to test the daily resistance 1.
Amid the previous events, the price is still moving between the levels of 1.2270 and 1.2329. If the NZD/USD pair succeed to break through the resistance level of 1.2329, the market will rise further to 1.2344 as as the second target.
However, stop-loss is to be placed below the price of 1.2270.


