Technical Market Overview:
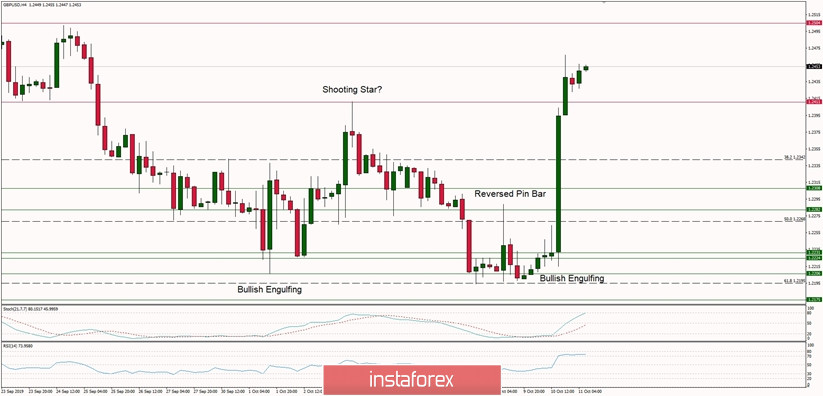
The GBP/USD pair has bounced from the technical support at the level of 1.2231 in a spectacular way as the enormous Bullish Engulfing candlestick pattern had been made at the H4 timeframe chart. During this move up, the technical resistance located at the level of 1.2411 has been violated and will act now as a support for the price. The local high was made at the level of 1.246, so traders should have in mind, that a clear breakout above the level of 1.2411 will open the road towards the next technical resistance located at the level of 1.2504. It is worth to keep an eye on the current market situation.
Weekly Pivot Points:
WR3 - 1.2623
WR2 - 1.2518
WR1 - 1.2423
Weekly Pivot - 1.2315
WS1 - 1.2215
WS2 - 1.2101
WS3 - 1.2006
Trading recommendations:
The best strategy for current market conditions is to trade with the larger timeframe trend, which is down. All upward moves will be treated as local corrections in the downtrend. In order to reverse the trend from down to up, the key level for bulls is seen at 1.2504 and it must be clearly violated. The key short-term technical support is seen at the level of 1.2231 - 1.2224 and the key short-term technical resistance is located at the level of 1.2381. As long as the price is trading below this level, the downtrend continues towards the level of 1.1957 and below.


