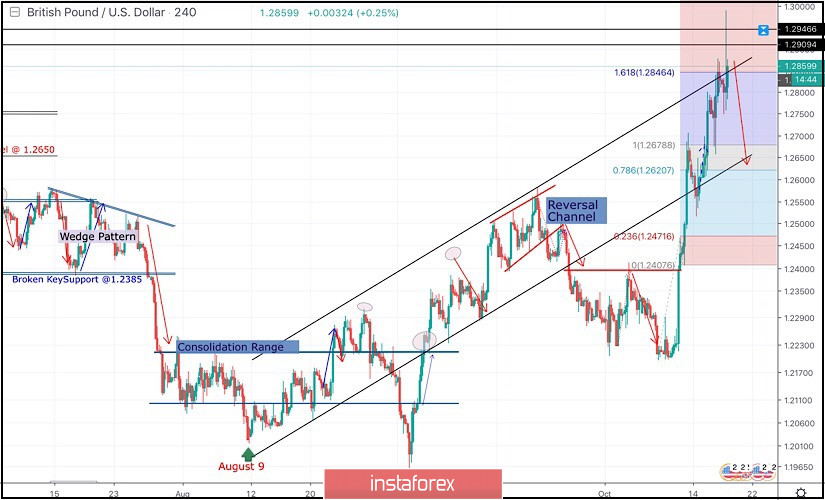
On September 20, Recent episode of bullish advancement was expressed inside the depicted bullish channel towards 1.2550 where a short-term reversal channel was demonstrated.
As anticipated, the reversal pattern was confirmed to the downside on September 23 demonstrating a successful bearish closure below 1.2450.
On September 25, the depicted bullish channel was invalidated with significant full-body bearish candlesticks which managed to achieve bearish closure below 1.2400.
Bearish persistence below 1.2400-1.2440 (Reversal-Pattern Neckline) allowed more bearish decline to occur towards the price levels of 1.2210 where a recent Double-Bottom reversal pattern was originated with neckline located around 1.2400.
Last week, the price zone of 1.2400-1.2415 (reversal pattern neckline) was breached to the upside allowing further bullish advancement to occur towards 1.2680.
Bullish persistence above 1.2680 enhances further bullish advancement towards 1.2846 (161% Fibonacci Expansion).
However, This week, signs of bearish rejection are being demonstrated around 1.2850 (upper limit of the depicted movement channel) where the GBP/USD pair is failing to achieve a successful bullish breakout outside the channel.
That's why, sideway consolidations may be demonstrated down to 1.2680-1.2620 until breakout occurs in either directions (More probably to the downside).
Bearish persistence below 1.2850 will probably bring further bearish decline towards 1.2680-1.2620 where the lower limit of the current bullish movement comes to meet the pair.
Trade Recommendations:
Intraday traders are advised to wait for a bearish breakout below 1.2780 for a valid SELL entry.
T/P levels to be placed around 1.2680 and 1.2620 while S/L should be placed above 1.2920.


