


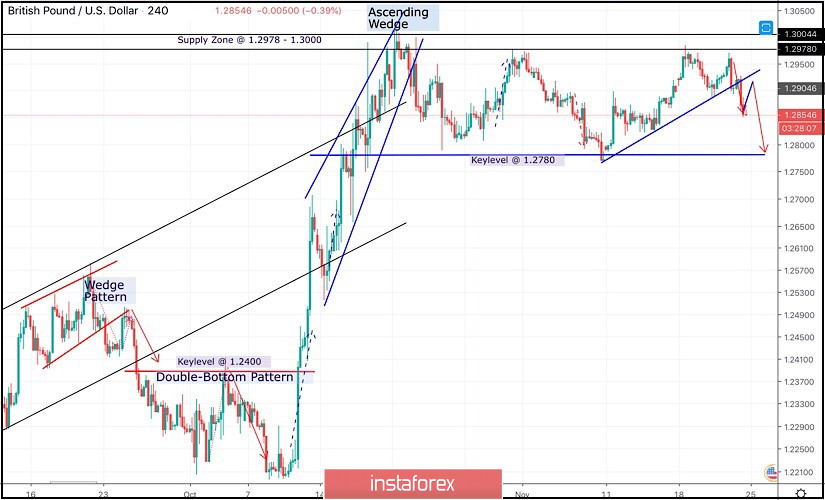
Few weeks ago, Further Bullish advancement was demonstrated towards 1.2650 then 1.3000 after the neckline of the depicted Double-Bottom pattern (1.2400-1.2415) was breached to the upside.
Since October 21, the GBP/USD pair has failed to achieve a persistent bullish breakout above the depicted SUPPLY-zone (1.2980-1.3000) which corresponds to a previous Prominent-TOP that goes back to May 2019.
Moreover, an ascending wedge reversal pattern was confirmed on October 22. This indicated a high probability of bearish reversal around the mentioned price zone.
Hence, a quick bearish movement was anticipated towards 1.2780 (Key-Level) where bullish recovery was recently demonstrated on two consecutive visits.
Since then, the GBP/USD pair has been trapped between the mentioned price levels (1.2780-1.2980) until now.
Technical outlook remains bearish as long as consolidations are maintained below 1.3000 on the H4 chart.
Moreover, negative divergence was being demonstrated on the H4 chart. That's why, high probability of bearish rejection existed around the price levels of (1.2980-1.3000).
A quick bearish breakout below 1.2875 (short-term uptrend) was needed to enable further bearish decline towards 1.2780 where a better decision can be taken upon recent price action.
On the other hand, any bullish pullback towards 1.2915 should be watched for early bearish rejection and another valid SELL entry.


