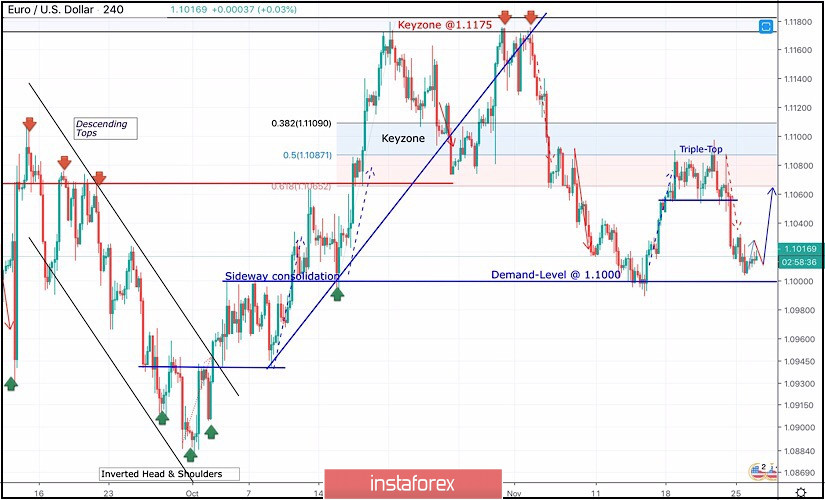
On October 2, an Inverted Head & Shoulders reversal Pattern was demonstrated around 1.0880.
Few days later, bullish breakout above 1.0940 (neckline) confirmed the depicted pattern enabling further bullish advancement towards (1.1000 -1.1020).
Since then, the EURUSD pair has trended-up until October 21 when the pair hit the price level of 1.1175.
The price zone of (1.1175 - 1.1190) stood as a significant SUPPLY-Zone that demonstrated bearish rejection for two consecutive times in a short-period.
Hence, a long-term Double-Top pattern was demonstrated with neckline located around 1.1075-1.1090 which offered valid bearish positions few weeks ago.
That's why, initial bearish decline was executed towards 1.1025 and 1.0995 where another episode of bullish pullback was initiated.
Recently, the mentioned bullish pullback was demonstrated towards 1.1065-1.1085 where a cluster of supply levels were located (61.8% Fibo - 50% Fibo levels).
Supply-Levels around 1.1065-1.1085 demonstrated significant bearish rejection that brought the pair back towards 1.1000.
The current price action suggests a high probability of bullish reversal around 1.1000-1.1020 that brings the EURUSD pair again towards 1.1065-1.1085.
Thus the EUR/USD pair remains trapped between the price levels of 1.1000 and 1.1085 until breakout occurs in either directions.
Please note that any bullish breakout above 1.1110 invalidates the mentioned bearish scenario allowing further bullish advancement towards 1.1150.


