


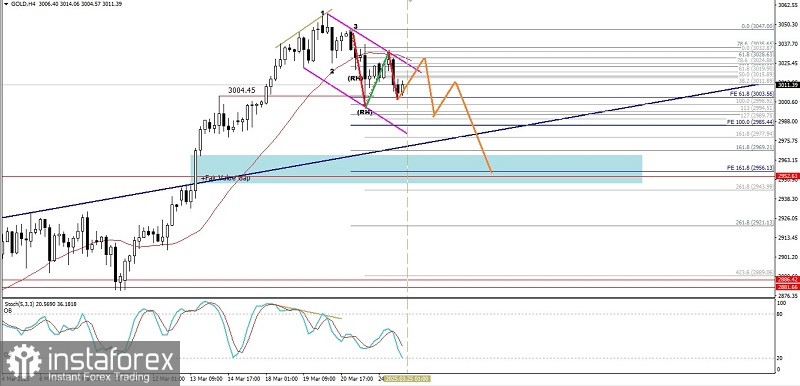
If we look at the 4-hour chart of the Gold commodity instrument, a Bearish 123 pattern appears followed by several Bearish Ross Hook (RH) and is also confirmed by the movement of the Gold price moving below the WMA (30 Shift 2) which also has a downward slope and is also confirmed by the appearance of Negative Divergence between the movement of the Gold price and the Stochastic Oscillator indicator, then in the near future Gold has the potential to continue its weakening again where the level of 2998,92 will be tested to be broken and close below that level if successful then Gold will test the next target of 2985.44 and if the volatility and momentum of the weakening are strong enough then it is not impossible that Gold will continue its weakening to the level of 2956.13, however this weakening scenario will be invalid and automatically canceled if on its way to weakening suddenly there is a strengthening again until it breaks through and closes above the level of 3047.00.
(Disclaimer)


