


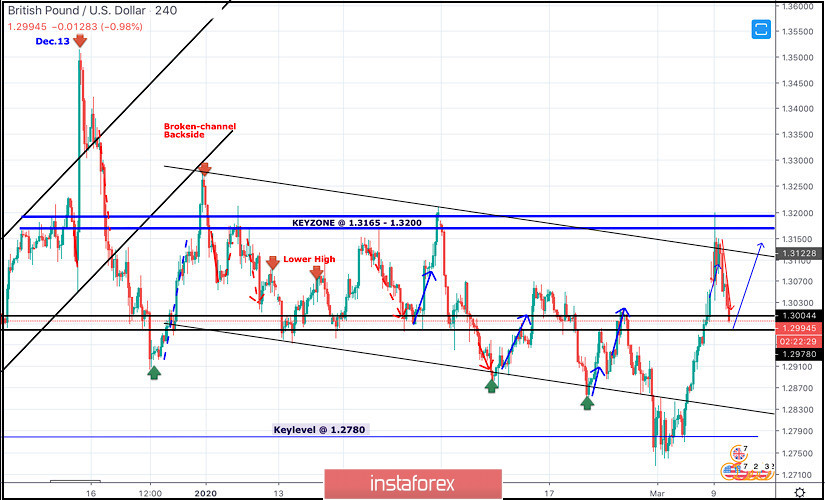
In the period between December 18th - 23rd, bearish breakout below the depicted previous bullish channel followed by quick bearish decline below 1.3000 were demonstrated on the H4 chart.
However, Immediate bullish recovery (around 1.2900) brought the pair back towards 1.3250 (backside of the broken channel) where the current wide-ranged movement channel was established below 1.3200.
Since January 13, progressive bearish pressure has been built over the price zone of 1.2980-1.3000 until February 5.
On February 6, recent bearish breakdown below 1.2980 enhanced further bearish decline towards 1.2890 (the lower limit of the movement channel) where two episodes of bullish rejection were manifested on February 10th and 20th.
Shortly after, the lower limit of the channel around 1.2850 has failed to provide enough bullish Support for the GBPUSD pair.
That's why, further bearish decline was expressed towards the nearest DEMAND level around 1.2780 where significant bullish rejection and an inverted Head & Shoulders reversal pattern was demonstrated in the period between Feb. 28 - March 4 especially after The Fed unexpectedly cut rates by half-point for the first time since 2008 to protect against an anticipated slowdown of US economy for the fear of a possible Corona Virus outbreak.
Hence, a quick bullish movement was demonstrated towards the price zone of 1.2980-1.3000 which has failed to offer enough bearish pressure on the GBPUSD pair.
The current bullish recovery was expected to pursue towards 1.3150-1.3200 where bearish rejection and bearish pullback was expected to exist.
Earlier Yesterday, Early signs of bearish rejection were manifested indicating a high-probability bearish pullback opportunity towards 1.2980.
The current price zone of 1.2980-1.3000 stands as a prominent demand-zone to be watched for bullish rejection and a valid BUY entry.
On the other hand, bearish persistence below 1.2980 enhances the bearish side of the market towards 1.2870 then 1.2830 if enough bearish momentum is maintained.


