


To open long positions on GBPUSD, you need:
In the first half of the day, after a sharp decline in the pound, the bulls tried to return to the support level of 1.3044 but failed to do so. As a result, the pound remained under pressure. The task of GBP/USD buyers remains the same – it is a breakthrough and consolidation above the resistance of 1.3044, which will necessarily lead to repeated purchases in the area of the maximum of 1.3095, and it is quite possible to update the area of 1.3143, where I recommend fixing the profits. If the bulls do not show activity in the near future, it is best to count on long positions only after forming a false breakdown in the resistance area of 1.2996 or buy immediately for a rebound from the minimum of 1.2951. All attention will continue to shift to news about the coronavirus and negotiations between the UK and the EU.
To open short positions on GBPUSD, you need:
Sellers managed to cope with the level of 1.3044, which I paid attention to this morning, and fixing below this range keeps the downward potential in the pound, which in the near future may lead to a support test of 1.2996. The lack of activity among sellers in this area is likely to push GBP/USD even lower to a minimum of 1.2951, where I recommend fixing the profits. In the scenario of buyers returning their resistance to 1.3044, I recommend that short positions be postponed only until the test of 1.3095, and a false breakdown is formed there, or sell the pound immediately on a rebound from the maximum of 1.3143.
Signals of indicators:
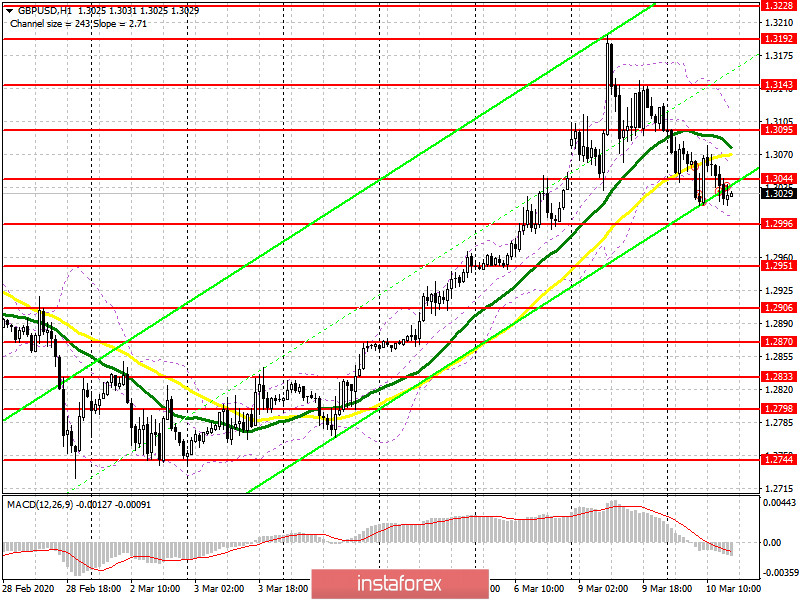
Moving averages
Trading is conducted below the 30 and 50 daily averages, which indicates that the downward correction potential is still there.
Bollinger Bands
A break in the lower border of the indicator around 1.3010 will increase the pressure on the pair. Growth will be limited to the upper level in the area of 1.3120.
Description of indicators
- Moving average (moving average determines the current trend by smoothing out volatility and noise). Period 50. The graph is marked in yellow.
- Moving average (moving average determines the current trend by smoothing out volatility and noise). Period 30. The graph is marked in green.
- MACD indicator (Moving Average Convergence / Divergence - moving average convergence / divergence) Fast EMA period 12. Slow EMA period 26. SMA period 9
- Bollinger Bands (Bollinger Bands). Period 20


