


To open long positions on EURUSD, you need:
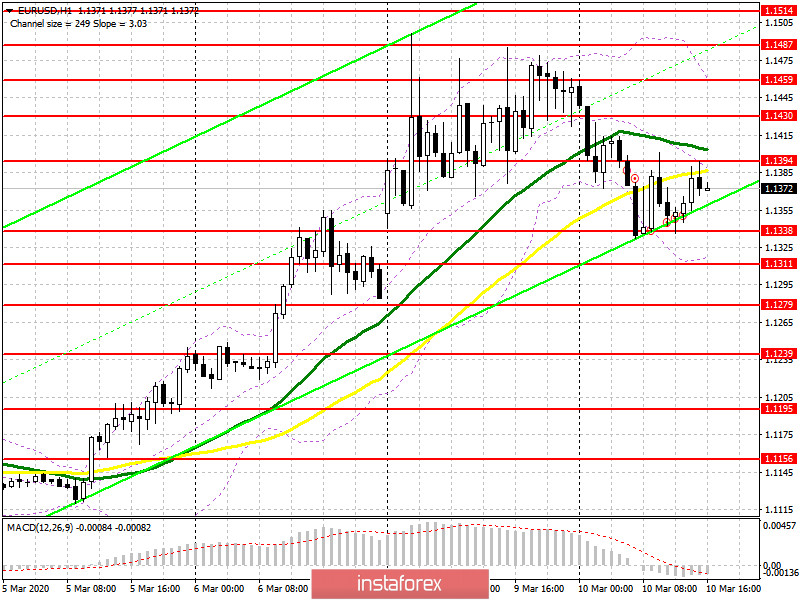
Data on the growth of industrial production in France and Italy did not impress traders, who continued to close long positions in the euro. In the morning forecast, I paid attention to purchases in the support area of 1.1338, which happened. At the moment, while trading is above this range, the bulls will try to build a new lower border of the ascending channel, as well as regain the resistance of 1.1394. Only in this scenario can we expect the upward trend to continue with the test of the highs of 1.1430 and 1.1459, where I recommend fixing the profits. If the pressure on EUR/USD continues in the second half of the day, then a repeated test of the minimum of 1.1338 will certainly lead to its breakdown. In this scenario, it is best to return to long positions on a false breakdown from the support of 1.1311 or buy the euro immediately on a rebound from the minimum of 1.1279.
To open short positions on EURUSD, you need:
The situation with the spread of coronavirus continues to maintain demand for risky assets, and when important support levels are updated, the bulls return to the market. In the second half of the day, the first signal to open short positions will be the formation of a false breakdown in the resistance area of 1.1394, but the more important task for sellers will be to repeat the test and break through the support of 1.1338. Only this will increase the pressure on the pair and lead to an update of the lows of 1.1311 and 1.1279, where I recommend fixing the profits. In the scenario of EUR/USD growth in the second half of the day above the resistance of 1.1394, it is best to return to short positions on the rebound from the maximum of 1.1430 and even higher, from the resistance of 1.1459.
Signals of indicators:
Moving averages
Trading is conducted just below the 30 and 50 moving averages, which indicates that the correction potential is still in the second half of the day.
Bollinger Bands
In case of further decline, the euro will be supported by the lower border of the indicator around 1.1311, while growth will be limited to the upper level in the area of 1.1459.
Description of indicators
- Moving average (moving average determines the current trend by smoothing out volatility and noise). Period 50. The graph is marked in yellow.
- Moving average (moving average determines the current trend by smoothing out volatility and noise). Period 30. The graph is marked in green.
- MACD indicator (Moving Average Convergence / Divergence - moving average convergence / divergence) Fast EMA period 12. Slow EMA period 26. SMA period 9
- Bollinger Bands (Bollinger Bands). Period 20


