


Gold bulls are trying to recapture the $1,500 level after testing for another time the key horizontal support around $1,460. Gold price shows oversold condition by the RSI and the Stochastic oscillator and it would not be a surprise to see end of week profit taking by bears.
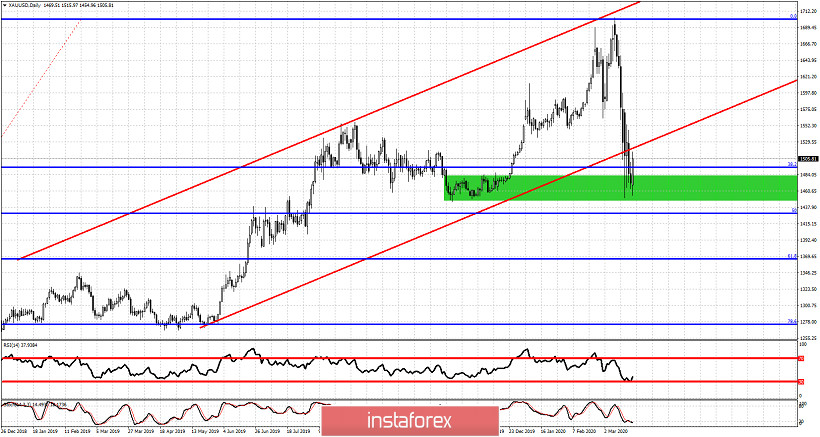
Red lines - bullish channel (broken)
Green rectangle - support area
Gold price is bouncing off the green support area. Price could back test the lower channel boundary at $1,520 as a back test. Rejection at $1,500-$1,520 would increase the chances of another sell of towards $1,450 and lower. However as this is the last trading day for the week, it would not be a surprise to see many bears take profits and help prices move higher as they buy to protect their gains. I believe this is the most probable scenario and I expect Gold price to bounce towards $1,550. Both the RSI and the Stochastic oscillator are at oversold levels. This is not the time to be adding to short positions.


