


USDJPY Chart Yesterday's Summary
Yesterday bulls took the price out of the range where the pair had been trading since 19.05.2020.
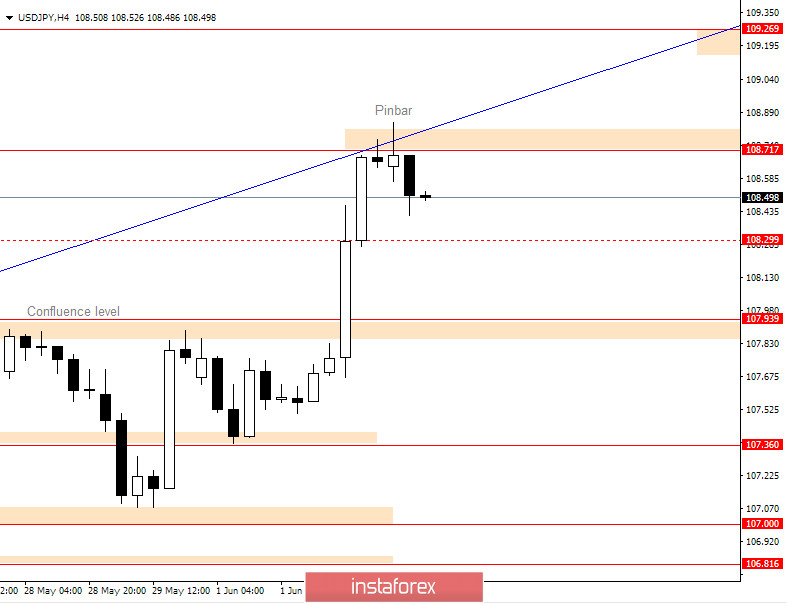
A breakout from the range area was started with Friday's pinbar on the daily time frame. That was a signal that we could see the price moving above resistance level at 107.939.
A strong breakout has formed two strong bullish candles on the way up to the next resistance level at 108.717.
USD/JPY Chart - Bullish Scenario
Bulls are stronger and that is clearly seen on the chart. The price has managed to breakout strongly and the next resistance that could hold bulls is the 109.269 level.
That level is next to a monthly trend line which will be hard to break. To have a valid breakout, we need to have a monthly close above that level.
Until that happens, we could see the price holding between 107.939 and 109.269.
USD/JPY Chart - Bearish Scenario
Bears will have hard time to bring the price back to the range area or even push the price lower. If bears want to show strength and discourage sellers, they need to bring the price below 107.939 and from there find the way below 107.36.
On the upper side, we could see bears waiting next to resistance at 109.269 which could attract more sellers that will push the price back down.
Until that happens, we should consider buying the pair on pullbacks.


