


XAU/USD Chart Yesterday's Summary
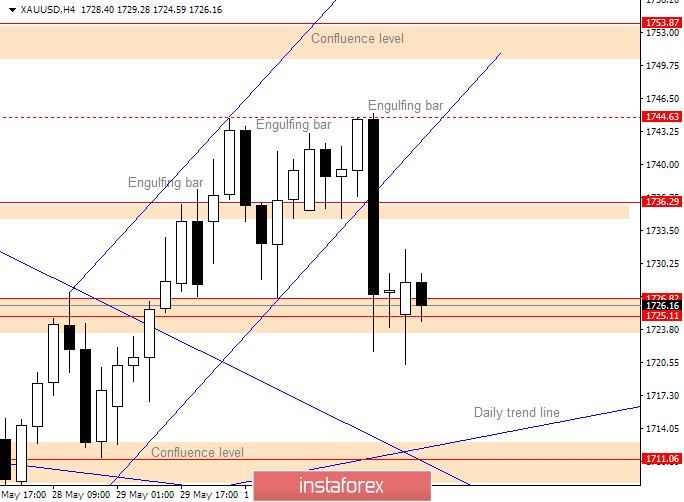
Yesterday price did not manage to move up above the previous H4 candle close to 1,744.63.
For the whole day, bulls were trying to push the price above and several bullish candles pointed we could see the price moving up.
In the second part of the day, the price fell through the support level at 1,736.29 that was holding the price above.
The fall occurred on the way to the 1,725.11 support that is now holding the price on the upper side. This level is also lower side of the previous range which we had in the second half of May. A strong bearish candle that engulfs two previous days means bears are in the game.
Moving down to 1,725.11, the uptrend channel on H4 is broken which means bulls have lost momentum.
XAU/USD Chart Forecast
From this point forward, we need to see where the price will close. The current status on the market with a strong bearish engulfing candle suggests we could see bears moving the price further down.
Bulls could wait on the strong confluence level at 1,711.06 level where the daily trend line and horizontal support line overlap. From there, the price could find support and look for the move higher.
XAU/USD Chart - Bullish Scenario
Bulls needs to show more strength in order to push the price higher from this level. The candle that looks like a combination of the bullish engulfing bar and the pinbar shows that the price could go upward. To verify that combination, we need the price close above 1,736.29.
Closing above will return buyers into the game that could push the price higher to strong resistance at 1,753.87.
XAU/USD Chart - Bearish Scenario
Bears are at strong support level that was not easy to break when the price was in the range area in May. They have strong bearish engulfing candle that is supporting them.
A further move down will be possible if the price closes below 1,725.11 on a H4 time frame. Closing below that level, the next support where the price will stall is around 1,711.06.


