Main Quotes Calendar Forum
flag

FX.co ★ Ichimoku cloud indicator analysis of Gold

parent
Forex Analysis:::2020-06-08T11:25:06

Ichimoku cloud indicator analysis of Gold

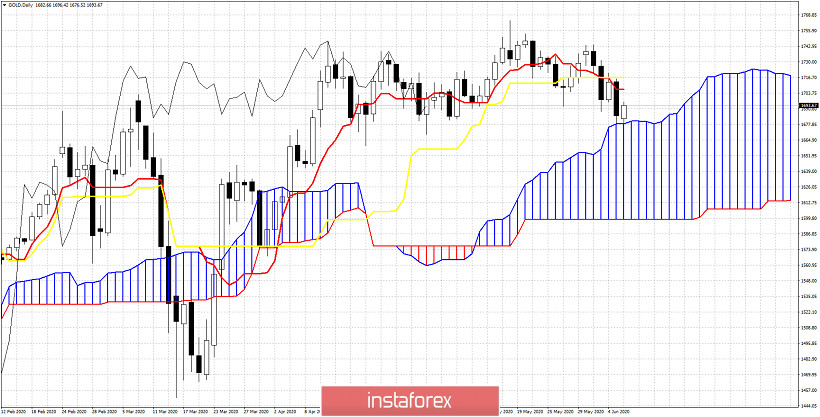
Gold price is bouncing off the Daily Kumo. Price has reached our target and is now bouncing. This is a bullish sign. As long as price is above the Kumo Daily trend is bullish. Gold could now bounce towards $1,715 resistance.

Ichimoku cloud indicator analysis of Gold

Price is below both the tenkan-sen and kijun-sen indicators. Breaking above the two indicators would be a bullish sign and could provide strength for new highs in Gold towards $1,800. The Chikou span (black line indicator) is challenging the candlestick pattern which provides support. Only a break below $1,670 will put the medium-term bullish trend in danger. Until then bulls have the upper hand. Gold price is making lower lows and lower highs. Latest lower high is at $1,720. Bulls need to break above this level in order to increase their chances for new highs.
Analyst InstaForex
Share this article:
parent
loader...
all-was_read__icon
You have watched all the best publications
presently.
We are already looking for something interesting for you...
all-was_read__star
Recently published:
loader...
More recent publications...