


Gold price is breaking above short-term resistance. Price has held above the Ichimoku cloud and did not break the short-term support of $1,700-$1,705. Gold price is approaching key long-term resistance and could already have started its next leg higher towards $1,780-$1,825.
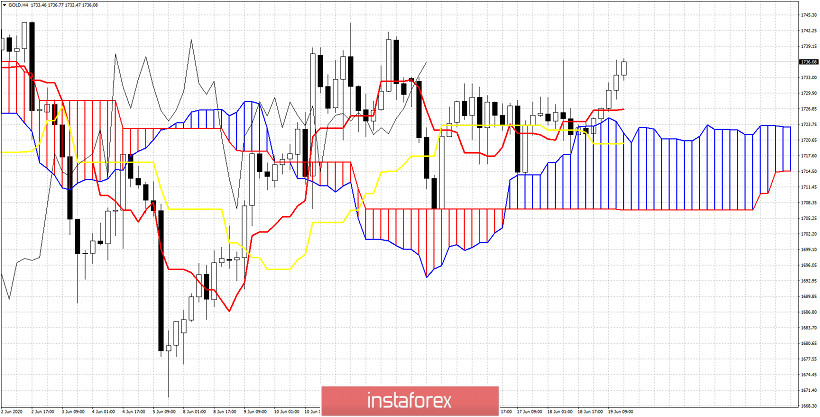
As we explained in our last analysis, it was imperative for bulls to hold above $1,700 and recapture $1,731 in order to continue to hope for a move towards $1,780-$1,825. Gold price briefly entered the Ichimoku cloud but today price is making new higher highs. Staying above the cloud is a bullish sign. Breaking and recapturing $1,730 is another bullish sign. Price is above the Kumo and both the tenkan-sen and kijun-sen indicators. The Chikou span (black line indicator) is also breaking above the candlestick formation.
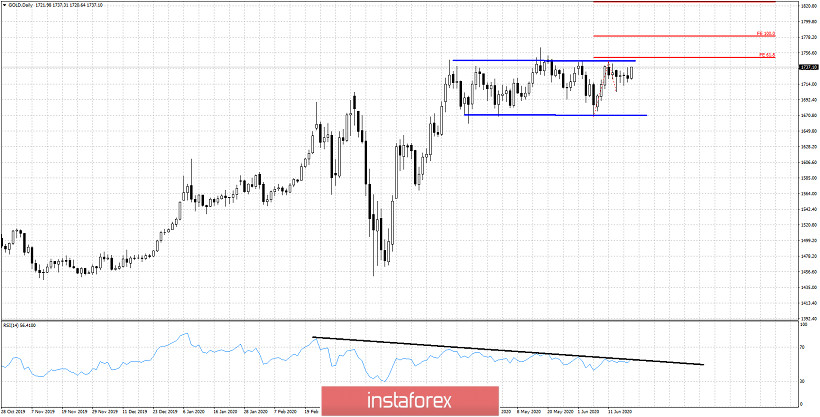
Black line -RSI resistance
Red lines- Fibonacci targets
Gold price is challenging the upper trading range boundary. If the RSI breaks the black trend line resistance and price above $1,750, we are heading towards $1,780-$1,825. Gold price so far has respected support levels. Now it seems that the time has come to exit the trading range its been in.


