Main Quotes Calendar Forum
flag

FX.co ★ Short-term Ichimoku cloud indicator analysis of EURUSD

parent
Forex Analysis:::2020-06-19T14:45:19

Short-term Ichimoku cloud indicator analysis of EURUSD

EURUSD remains in a bearish trend. Price is vulnerable to a move towards 1.1175-1.1135. We focus on the lower lows and lower highs pattern and on the trend line resistance of the RSI. Both point to a move lower.

Short-term Ichimoku cloud indicator analysis of EURUSD

Although Daily trend remains bullish as price is above the Kumo, we warned traders on time of the coming pull back. Price could continue its decline towards the 1.11 level where we find the kijun-sen (yellow line) indicator. Resistance is found at 1.1300 by the tenkan-sen (red line ) indicator.

Short-term Ichimoku cloud indicator analysis of EURUSD

Blue lines - bullish channel broken

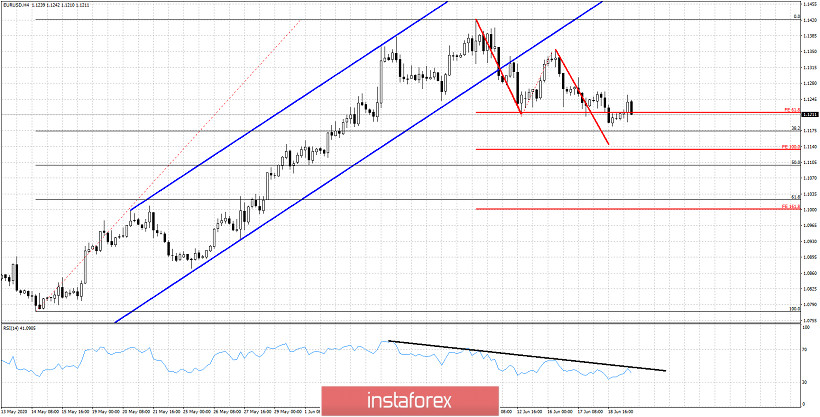
Black line- RSI resistance

Red lines - expected path

EURUSD was expected to pull back towards the 38% Fibonacci retracement. EURUSD has potential to move towards the 100% extension of the first leg down, towards the 50% retracement. As long as price is below 1.1260 and as long as the RSI is below the black trend line, we remain bearish.

Analyst InstaForex
Share this article:
parent
loader...
all-was_read__icon
You have watched all the best publications
presently.
We are already looking for something interesting for you...
all-was_read__star
Recently published:
loader...
More recent publications...